
Bistability, bifurcation and hysteresis are ubiquitous phenomena that arise from nonlinear dynamics and have considerable importance for technology applications. For instance, the hysteresis associated with the flipping of magnetic domains under magnetic fields is the central mechanism for magnetic memory, and bistability is a key feature of switching technology.
… one of the most commonly encountered bifurcations is called a saddle-node bifurcation, which is the bifurcation that occurs in the biased double-well potential.
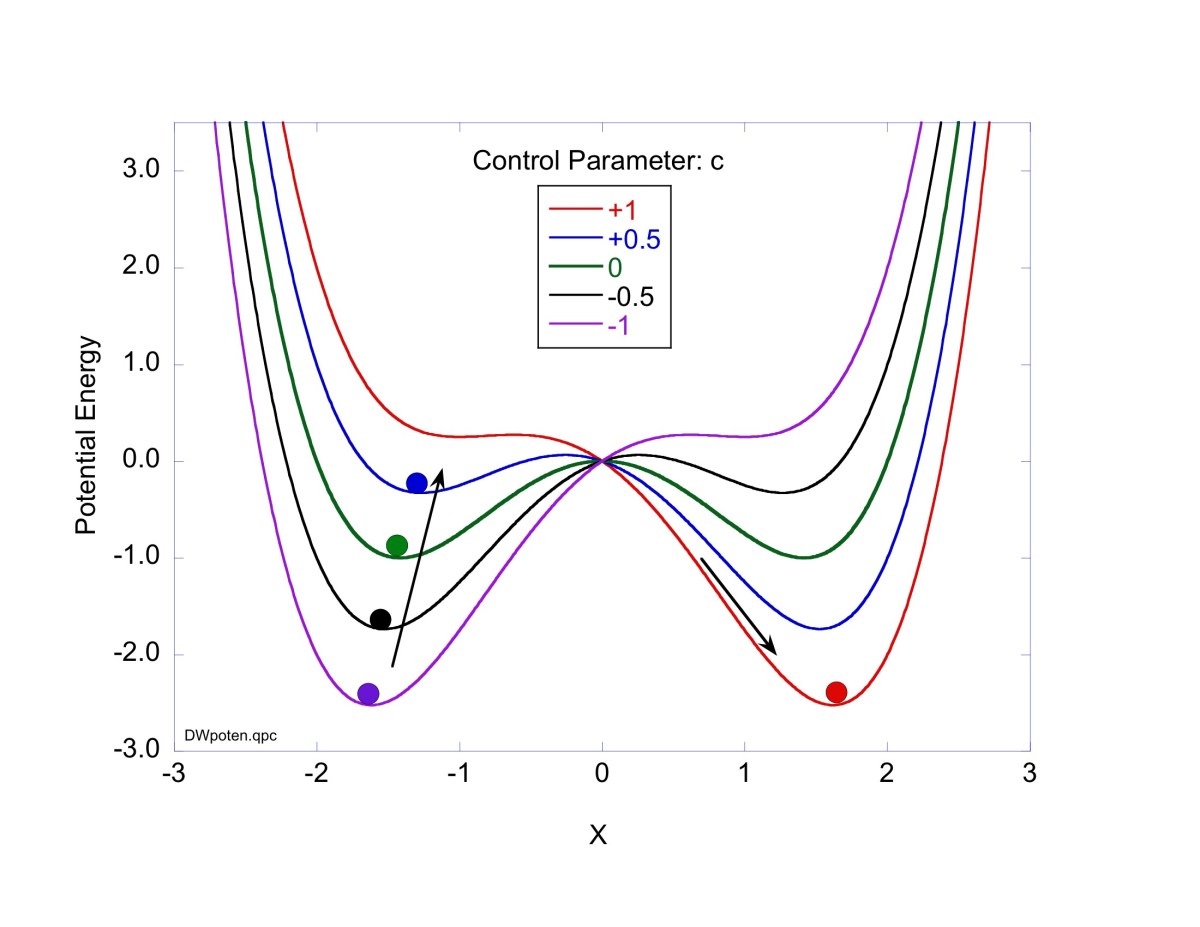
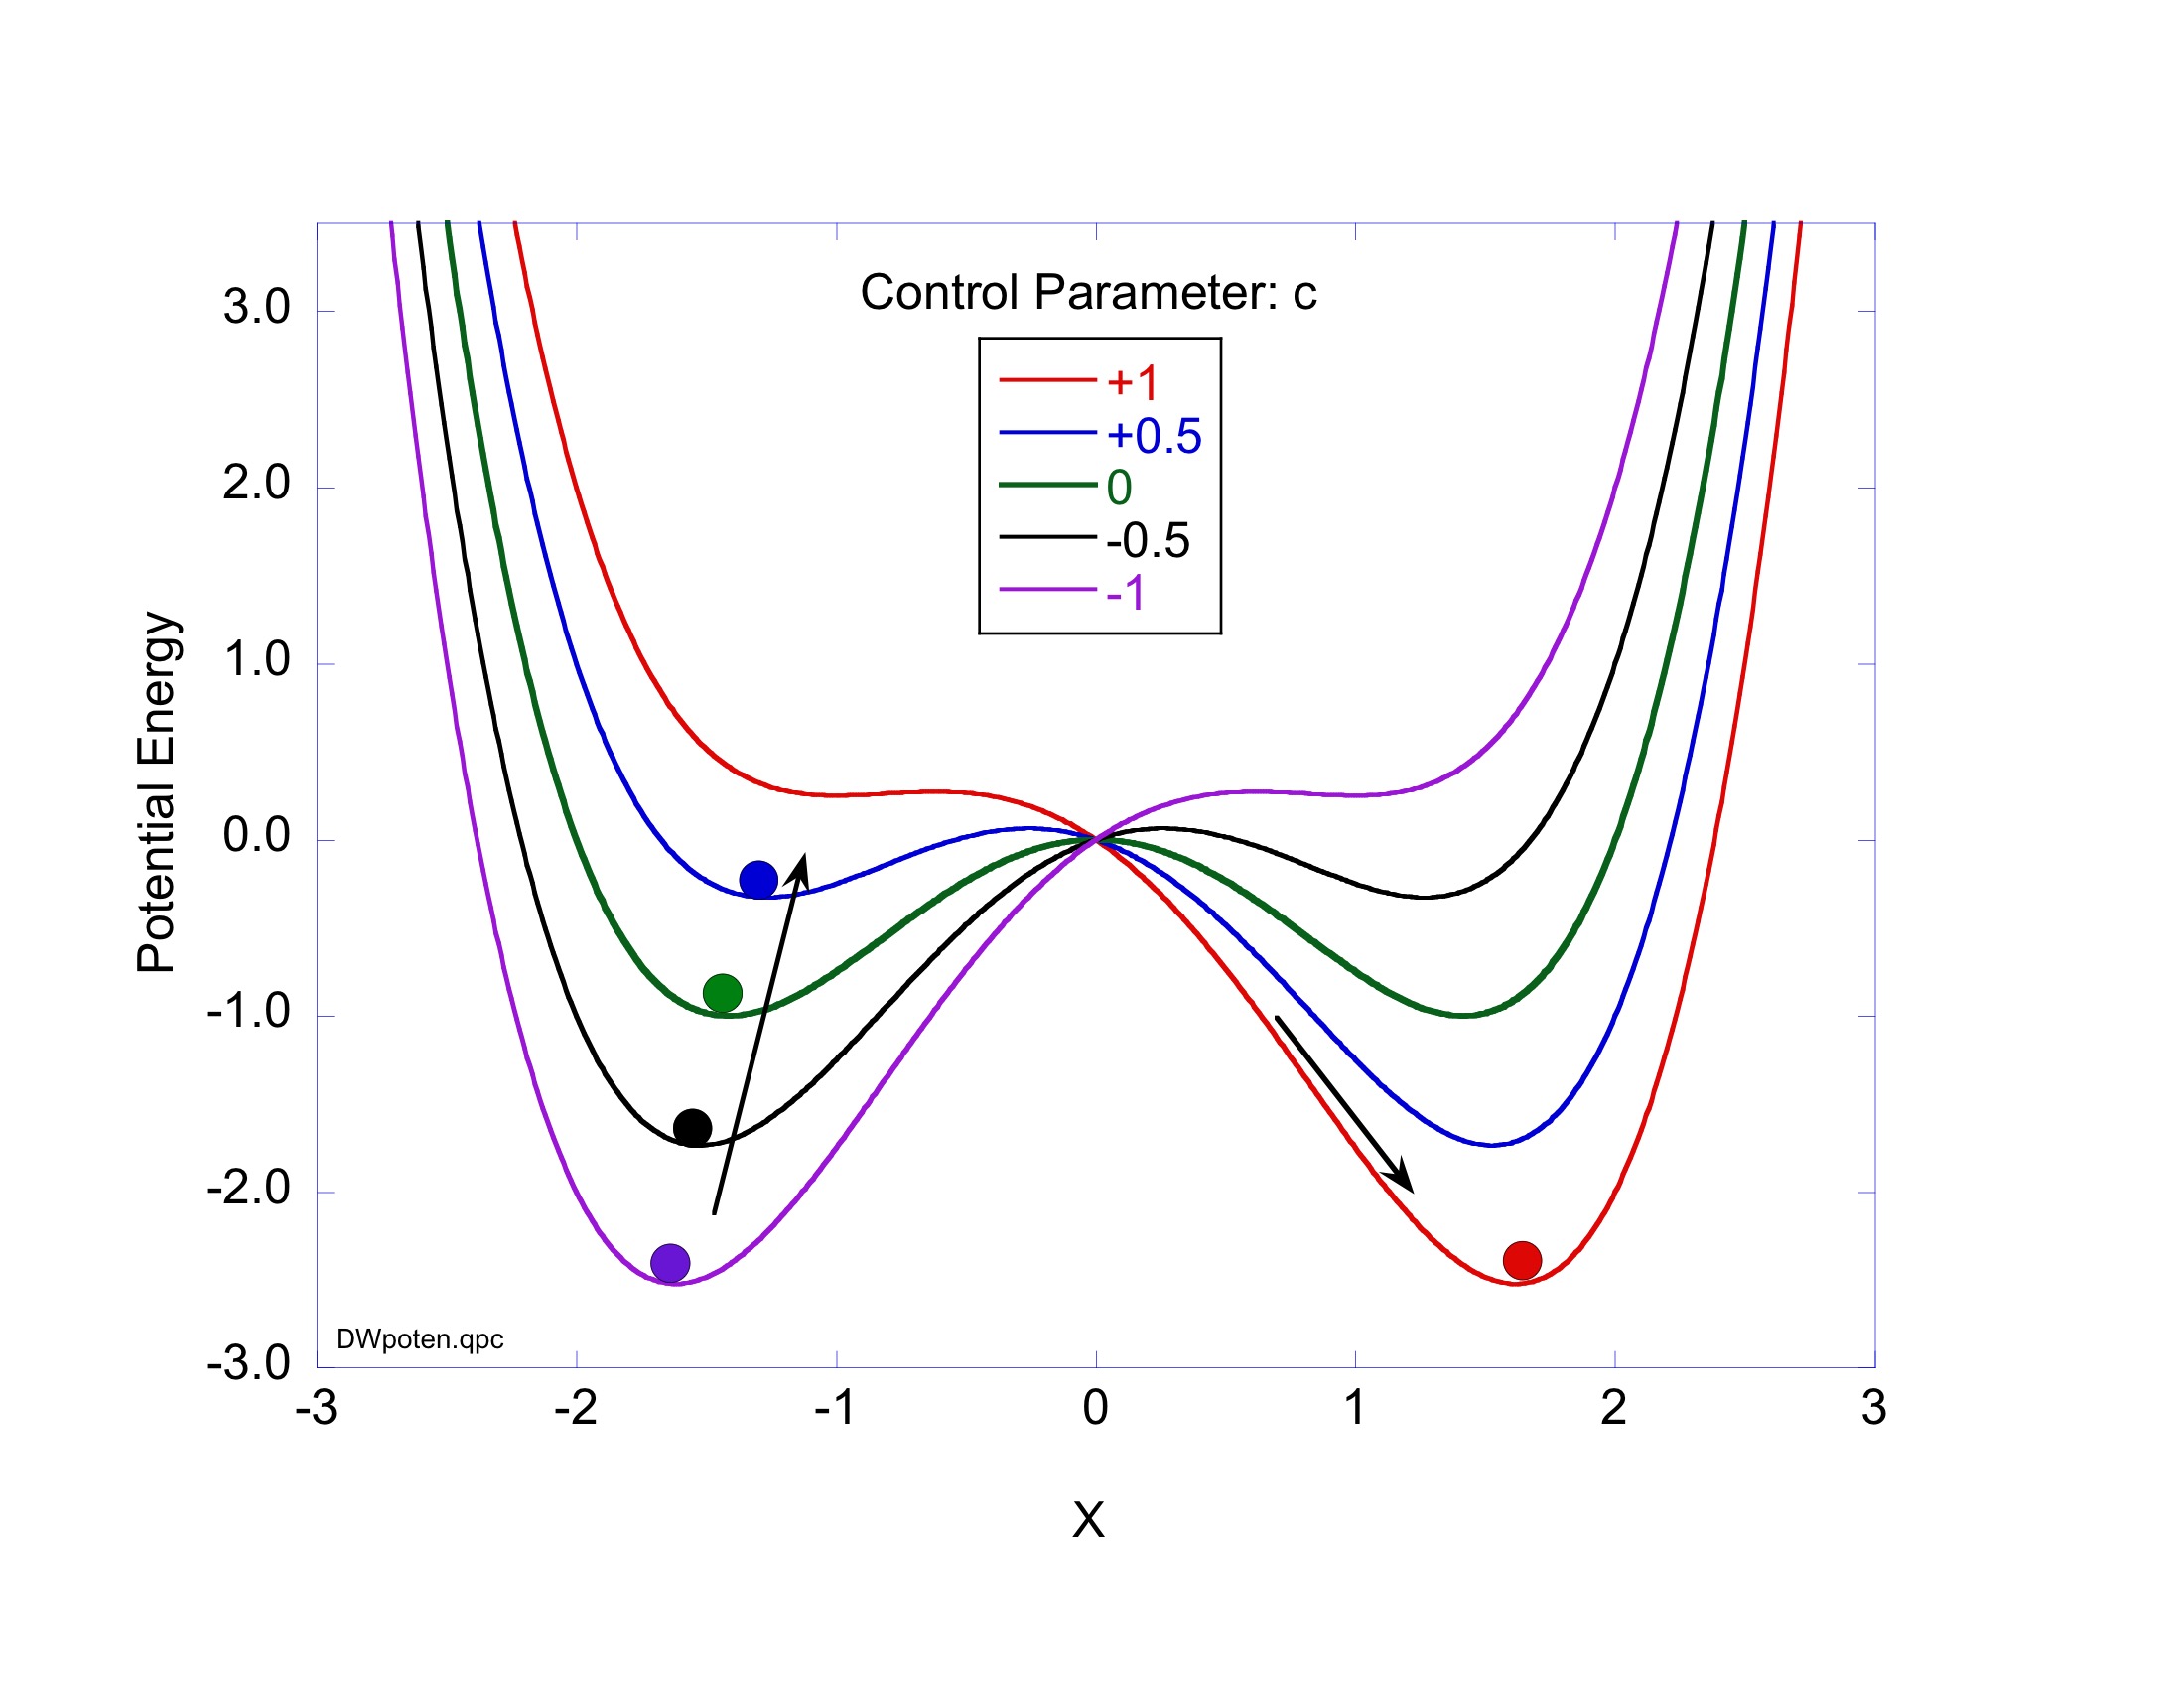
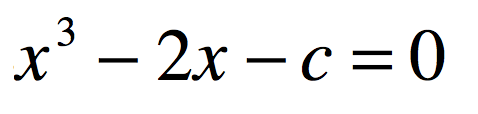
One of the simplest models for bistability and hysteresis is the one-dimensional double-well potential biased by a changing linear potential. An example of a double-well potential with a bias is
where the parameter c is a control parameter (bias) that can be adjusted or that changes slowly in time c(t). This dynamical system is also known as the Duffing oscillator. The net double-well potentials for several values of the control parameter c are shown in Fig. 1. With no bias, there are two degenerate energy minima. As c is made negative, the left well has the lowest energy, and as c is made positive the right well has the lowest energy.
The dynamics of this potential energy profile can be understood by imagining a small ball that responds to the local forces exerted by the potential. For large negative values of c the ball will have its minimum energy in the left well. As c is increased, the energy of the left well increases, and rises above the energy of the right well. If the ball began in the left well, even when the left well has a higher energy than the right, there is a potential barrier that the ball cannot overcome and it remains on the left. This local minimum is a stable equilibrium, but it is called “metastable” because it is not a global minimum of the system. Metastability is the origin of hysteresis.
Once sufficient bias is applied that the local minimum disappears, the ball will roll downhill to the new minimum on the right, and in the presence of dissipation, it will come to rest in the new minimum. The bias can then be slowly lowered, reversing this process. Because of the potential barrier, the bias must change sign and be strong enough to remove the stability of the now metastable fixed point with the ball on the right, allowing the ball to roll back down to its original location on the left. This “overshoot” defines the extent of the hysteresis. The fact that there are two minima, and that one is metastable with a barrier between the two, produces “bistability”, meaning that there are two stable fixed points for the same control parameter.
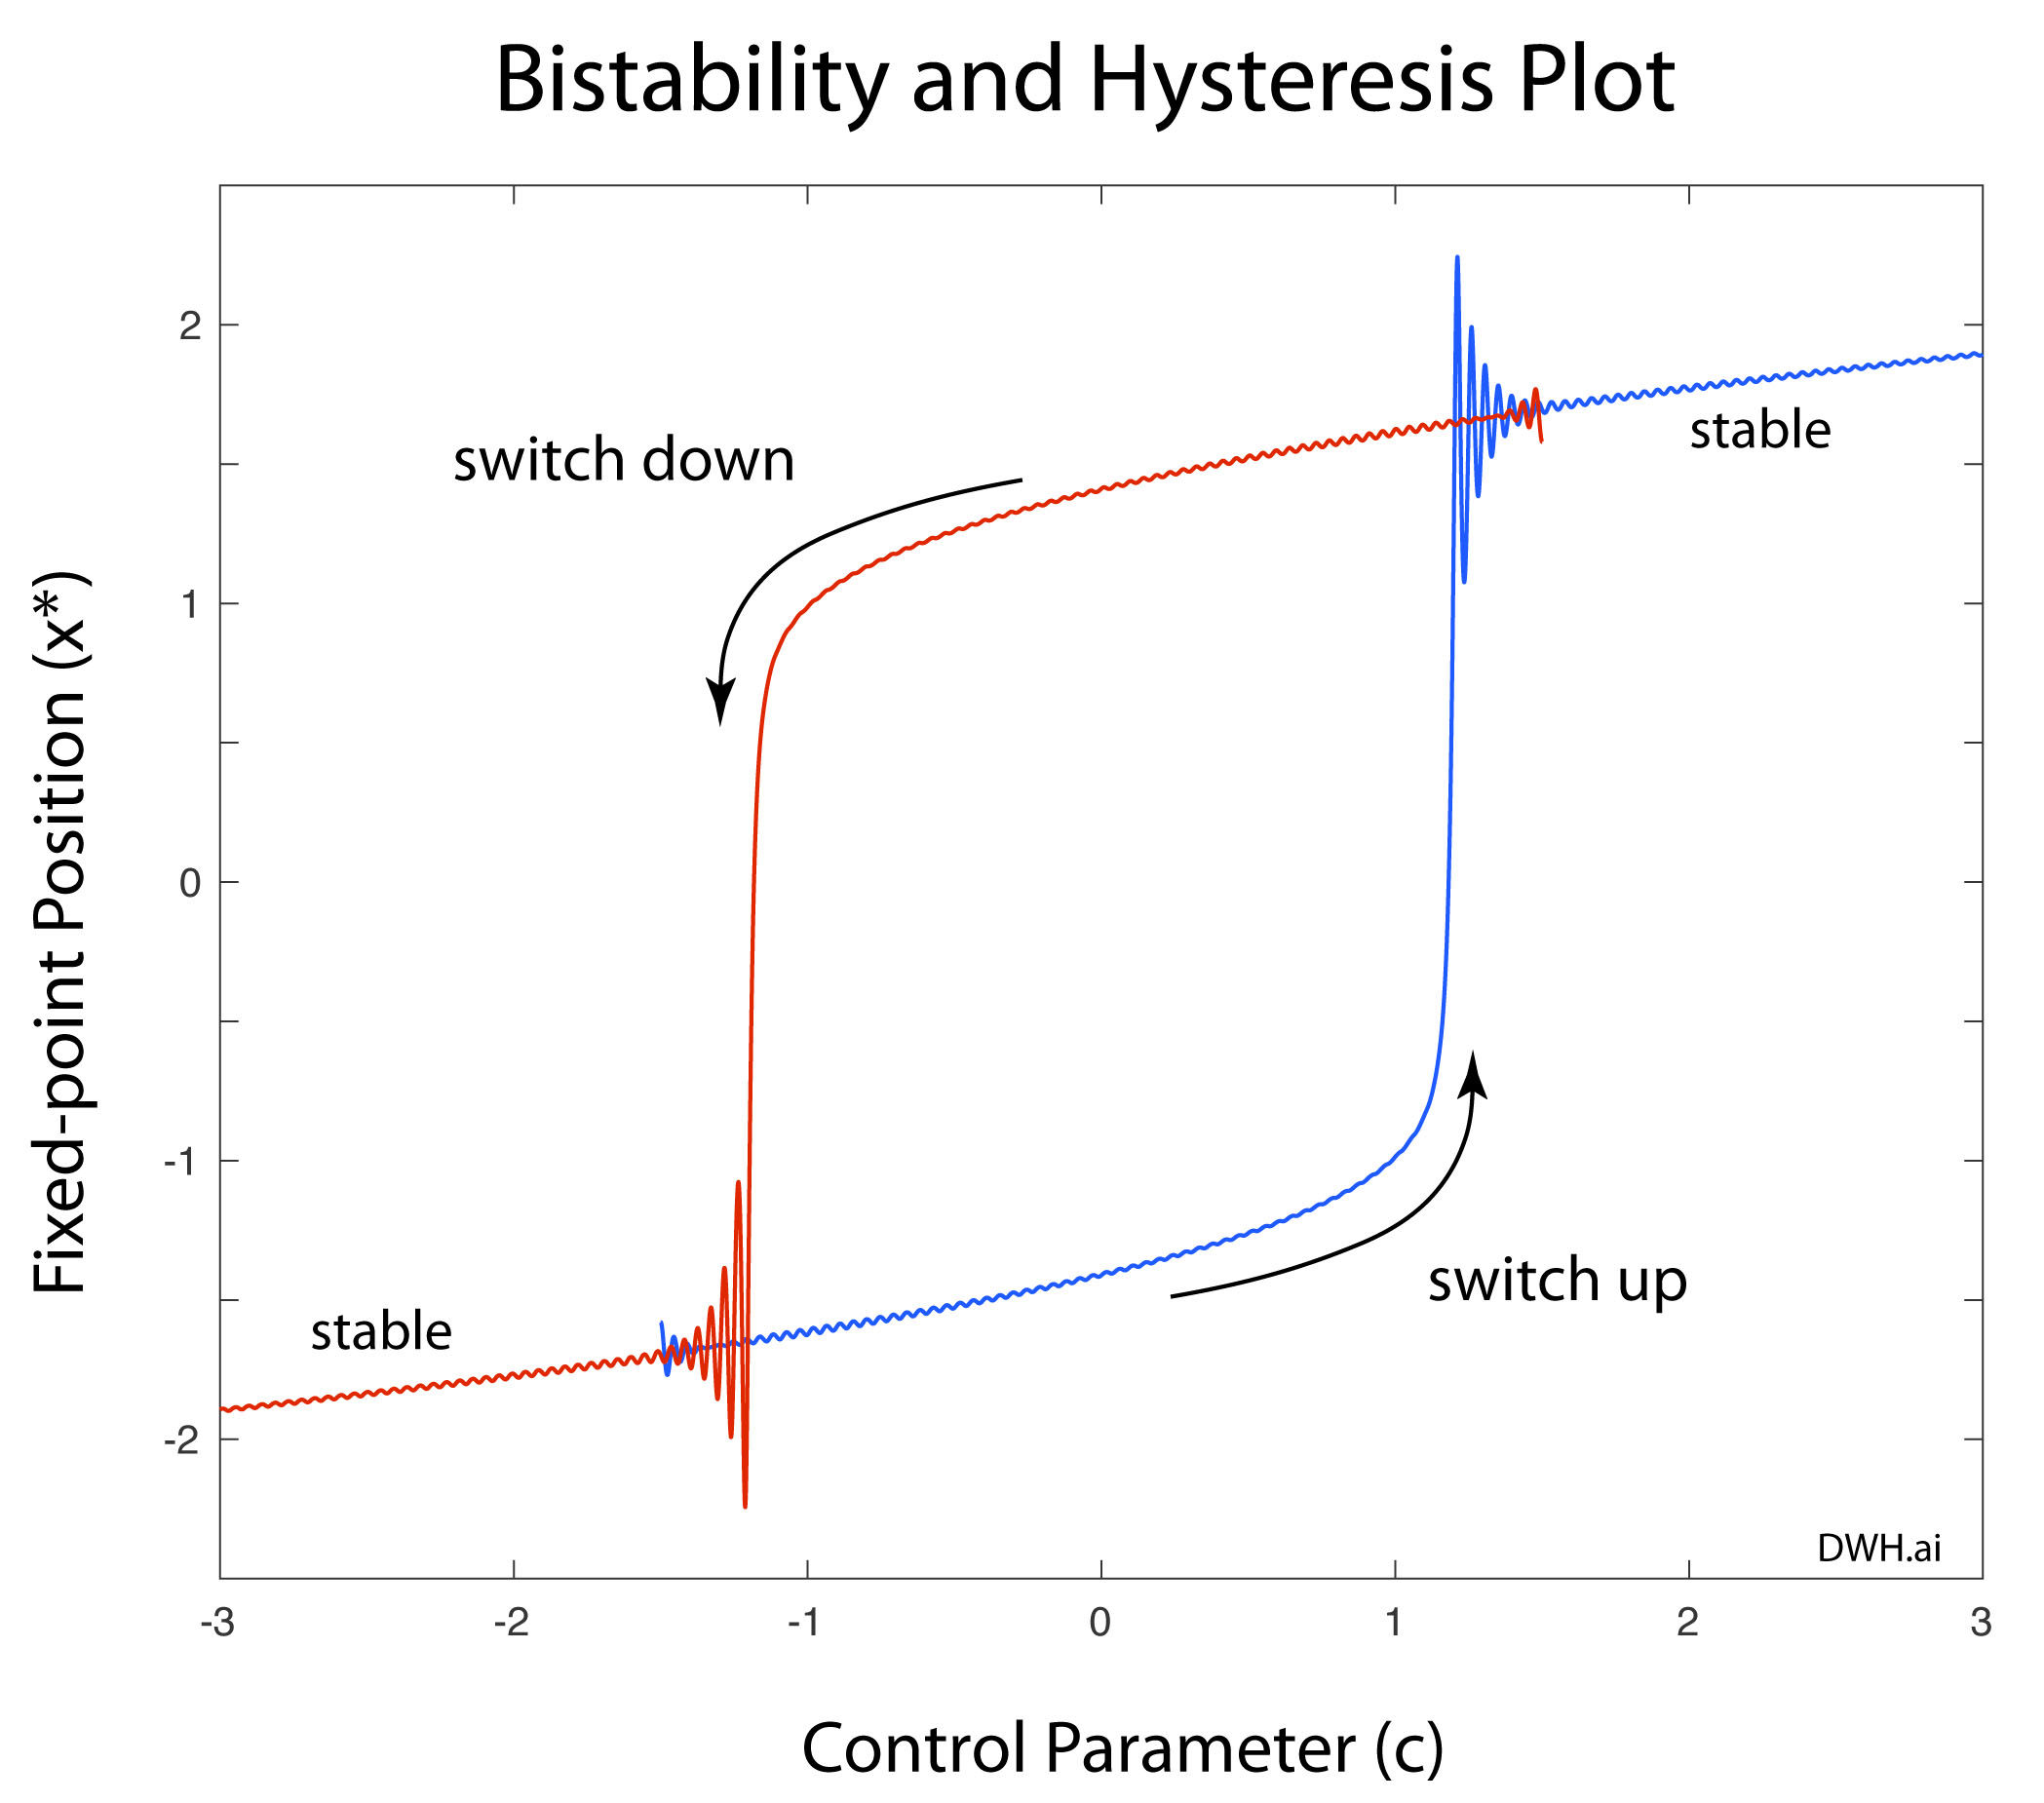
For illustration, assume a mass obeys the flow equation
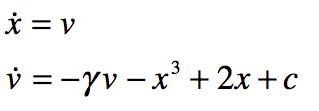
including a damping term, where the force is the negative gradient of the potential energy. The bias parameter c can be time dependent, beginning beyond the negative threshold and slowly increasing until it exceeds the positive threshold, and then reversing and decreasing again. The position of the mass is locally a damped oscillator until a threshold is passed, and then the mass falls into the global minimum, as shown in Fig. 2. As the bias is reversed, it remains in the metastable minimum on the right until the control parameter passes threshold, and then the mass drops into the left minimum that is now a global minimum.
The sudden switching of the biased double-well potential represents what is known as a “bifurcation”. A bifurcation is a sudden change in the qualitative behavior of a system caused by a small change in a control variable. Usually, a bifurcation occurs when the number of attractors of a system changes. There is a fairly large menagerie of different types of bifurcations, but one of the most commonly encountered bifurcations is called a saddle-node bifurcation, which is the bifurcation that occurs in the biased double-well potential. In fact, there are two saddle-node bifurcations.
Bifurcations are easily portrayed by creating a joint space between phase space and the one (or more) control parameters that induce the bifurcation. The phase space of the double well is two dimensional (position, velocity) with three fixed points, but the change in the number of fixed points can be captured by taking a projection of the phase space onto a lower-dimensional manifold. In this case, the projection is simply along the x-axis. Therefore a “co-dimensional phase space” can be constructed with the x-axis as one dimension and the control parameter as the other. This is illustrated in Fig. 3. The cubic curve traces out the solutions to the fixed-point equation
For a given value of the control parameter c there are either three solutions or one solution. The values of c where the number of solutions changes discontinuously is the bifurcation point c*. Two examples of the potential function are shown on the right for c = +1 and c = -0.5 showing the locations of the three fixed points.
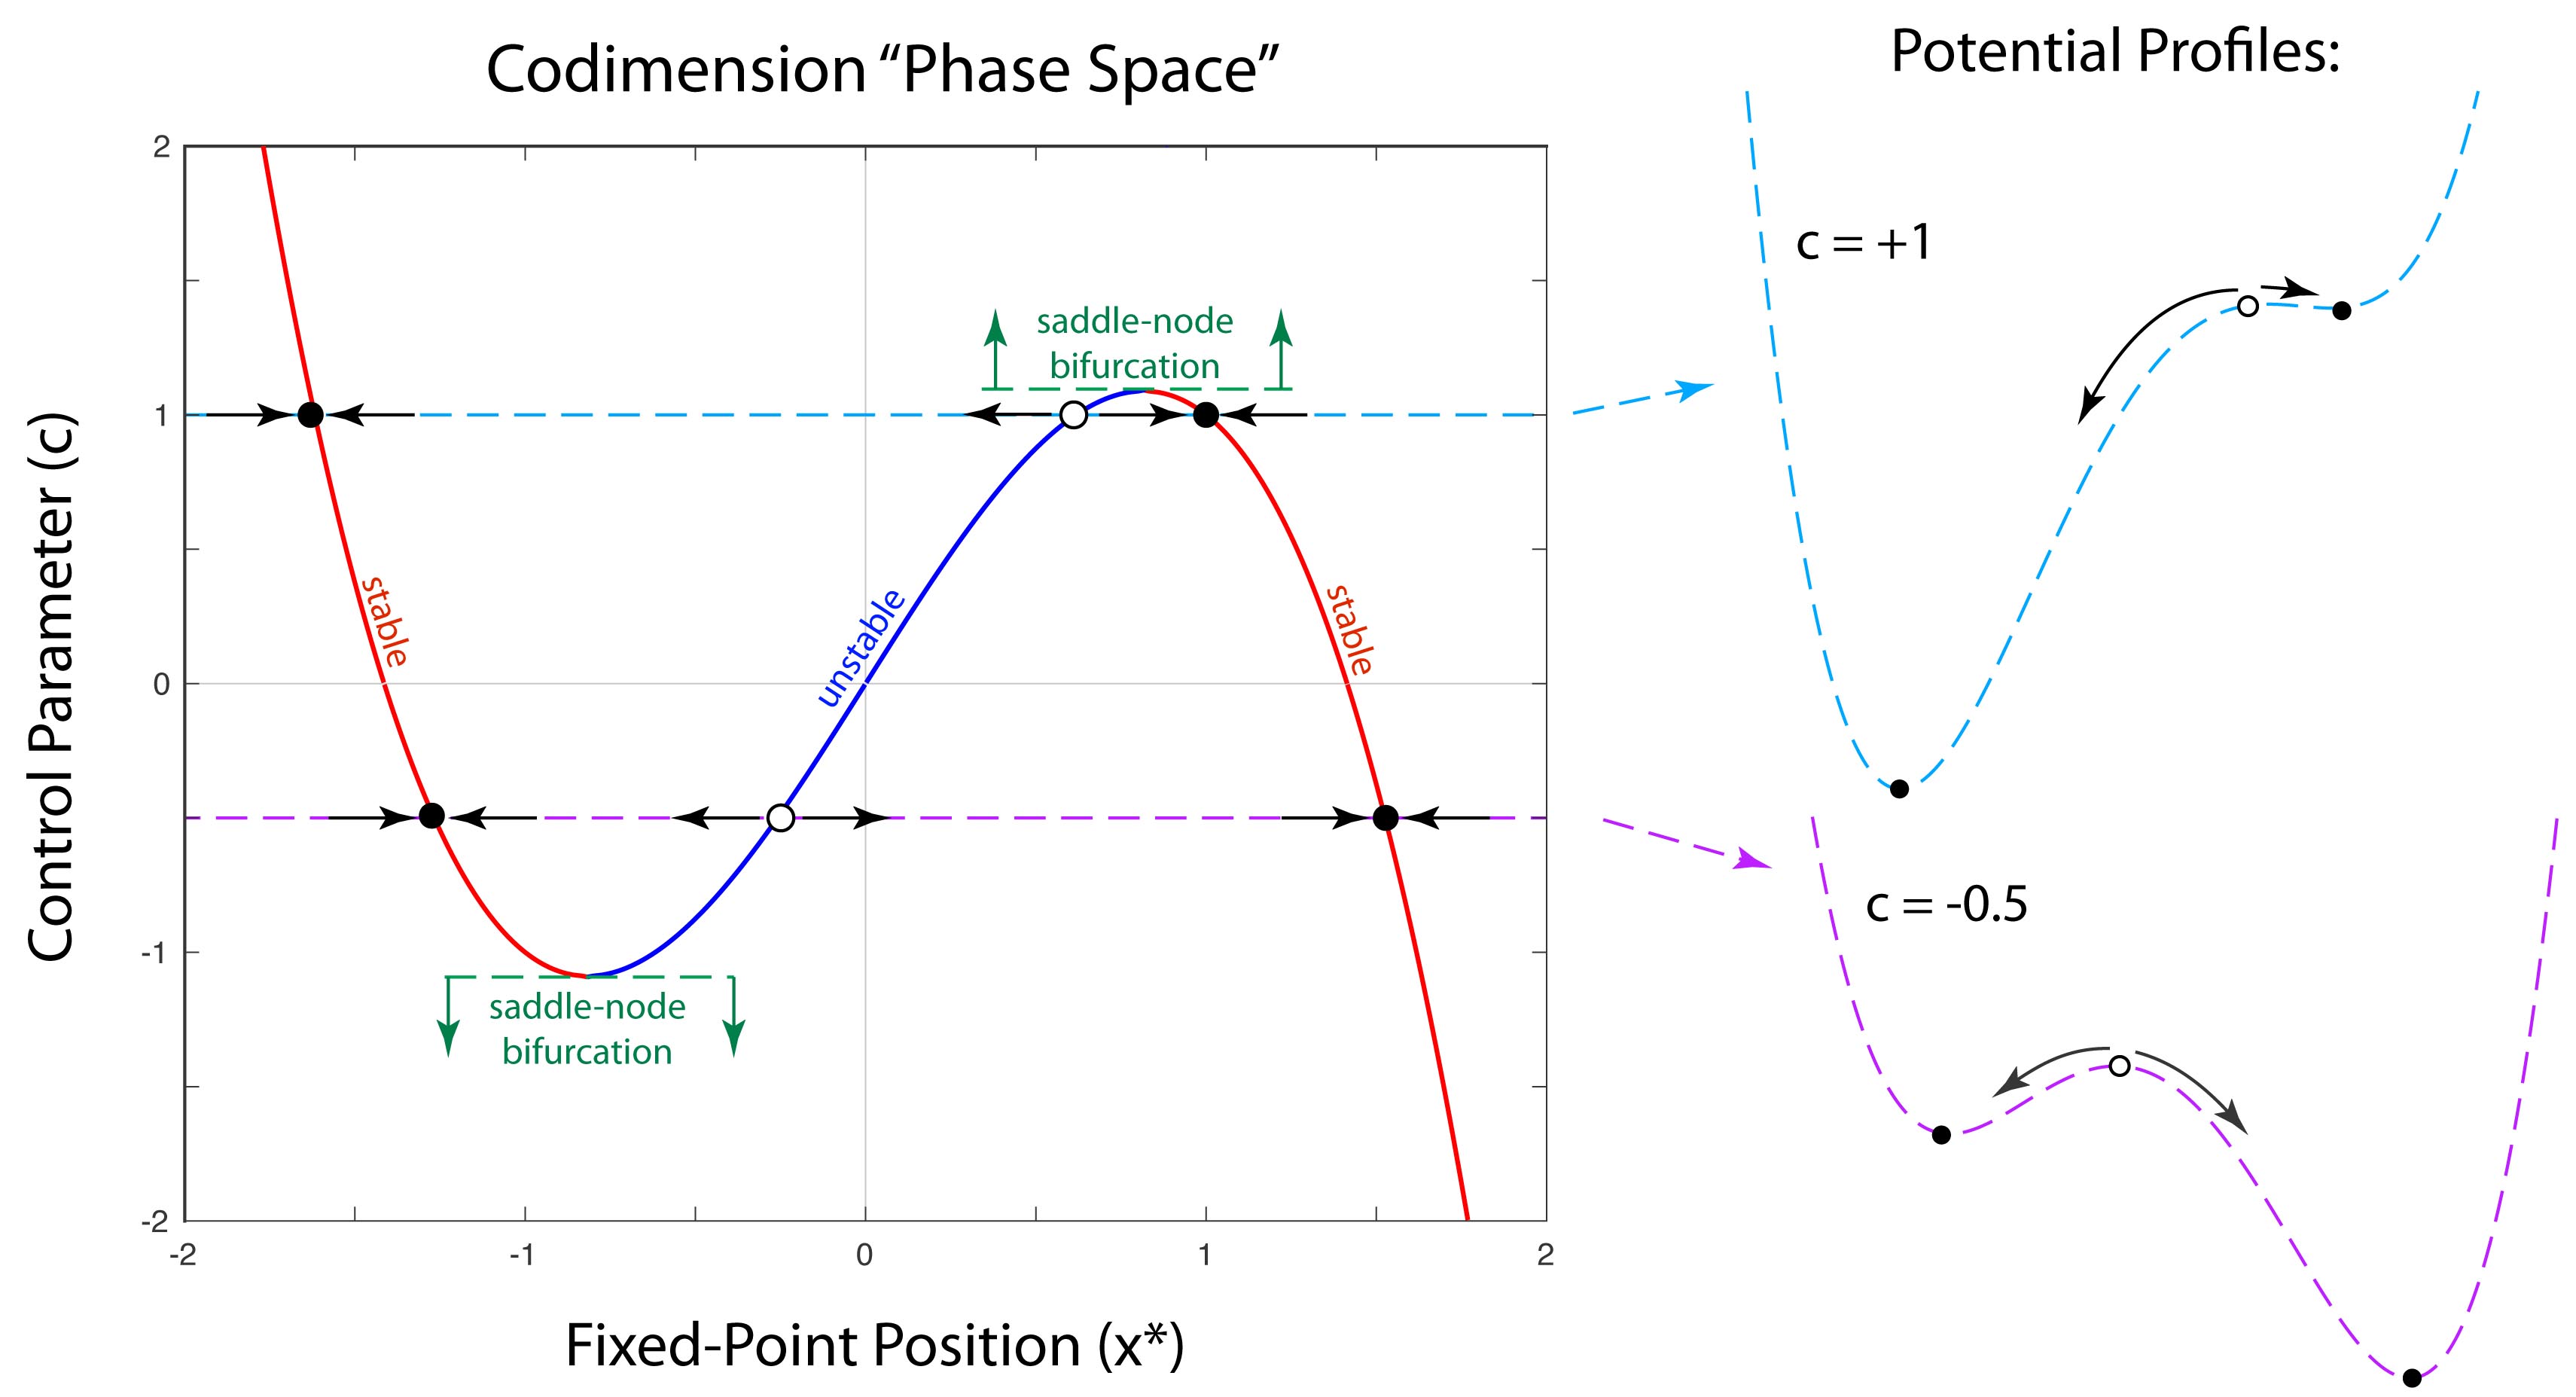
The threshold value in this example is c* = 1.05. When |c| < c* the two stable fixed points are the two minima of the double-well potential, and the unstable fixed point is the saddle between them. When |c| > c* then the single stable fixed point is the single minimum of the potential function. The saddle-node bifurcation takes its name from the fact (illustrated here) that the unstable fixed point is a saddle, and at the bifurcation the saddle point annihilates with one of the stable fixed points.
The following Python code illustrates the behavior of a biased double-well potential, with damping, in which the control parameter changes slowly with a sinusoidal time dependence.
Python Code: DWH.py
#!/usr/bin/env python3
# -*- coding: utf-8 -*-
"""
DWH.py
Created on Wed Apr 17 15:53:42 2019
@author: nolte
D. D. Nolte, Introduction to Modern Dynamics: Chaos, Networks, Space and Time, 2nd ed. (Oxford,2019)
"""

import numpy as np
from scipy import integrate
from scipy import signal
from matplotlib import pyplot as plt

plt.close('all')
T = 400
Amp = 3.5

def solve_flow(y0,c0,lim = [-3,3,-3,3]):

    def flow_deriv(x_y, t, c0):
        #"""Compute the time-derivative of a Medio system."""
        x, y = x_y

        return [y,-0.5*y - x**3 + 2*x + x*(2*np.pi/T)*Amp*np.cos(2*np.pi*t/T) + Amp*np.sin(2*np.pi*t/T)]

    tsettle = np.linspace(0,T,101)
    yinit = y0;
    x_tsettle = integrate.odeint(flow_deriv,yinit,tsettle,args=(T,))
    y0 = x_tsettle[100,:]

    t = np.linspace(0, 1.5*T, 2001)
    x_t = integrate.odeint(flow_deriv, y0, t, args=(T,))
    c  = Amp*np.sin(2*np.pi*t/T)

    return t, x_t, c

eps = 0.0001

for loop in range(0,100):
    c = -1.2 + 2.4*loop/100 + eps;
    xc[loop]=c

    coeff = [-1, 0, 2, c]
    y = np.roots(coeff)

    xtmp = np.real(y[0])
    ytmp = np.real(y[1])

    X[loop] = np.min([xtmp,ytmp])
    Y[loop] = np.max([xtmp,ytmp])
    Z[loop]= np.real(y[2])


plt.figure(1)
lines = plt.plot(xc,X,xc,Y,xc,Z)
plt.setp(lines, linewidth=0.5)
plt.show()
plt.title('Roots')

y0 = [1.9, 0]
c0 = -2.

t, x_t, c = solve_flow(y0,c0)
y1 = x_t[:,0]
y2 = x_t[:,1]

plt.figure(2)
lines = plt.plot(t,y1)
plt.setp(lines, linewidth=0.5)
plt.show()
plt.ylabel('X Position')
plt.xlabel('Time')

plt.figure(3)
lines = plt.plot(c,y1)
plt.setp(lines, linewidth=0.5)
plt.show()
plt.ylabel('X Position')
plt.xlabel('Control Parameter')
plt.title('Hysteresis Figure')
Further Reading:
D. D. Nolte, Introduction to Modern Dynamics: Chaos, Networks, Space and Time (2nd Edition) (Oxford University Press, 2019)
This Blog Post is a Companion to the undergraduate physics textbook Modern Dynamics: Chaos, Networks, Space and Time, 2nd ed. (Oxford, 2019) introducing Lagrangians and Hamiltonians, chaos theory, complex systems, synchronization, neural networks, econophysics and Special and General Relativity.


[…] Biased Double-well Potential: Bistability, Bifurcation and Hysteresis […]
LikeLike
[…] Biased Double-well Potential: Bistability, Bifurcation and Hysteresis […]
LikeLike
[…] Biased Double-well Potential: Bistability, Bifurcation and Hysteresis […]
LikeLike