Anant K. Ramdas in the Golden Age of Physics

The physicist, as a gentleman and a scholar, who, in his leisure, pursues physics as both vocation and hobby, is an endangered species, though they once were endemic.  Classic examples come from the turn of the last century, as Rayleigh and de Broglie and Raman built their own laboratories to follow their own ideas.  These were giants in their fields. But there are also many quiet geniuses, enthralled with the life of ideas and the society of scientists, working into the late hours, following the paths that lead them forward through complex concepts and abstract mathematics as a labor of love.

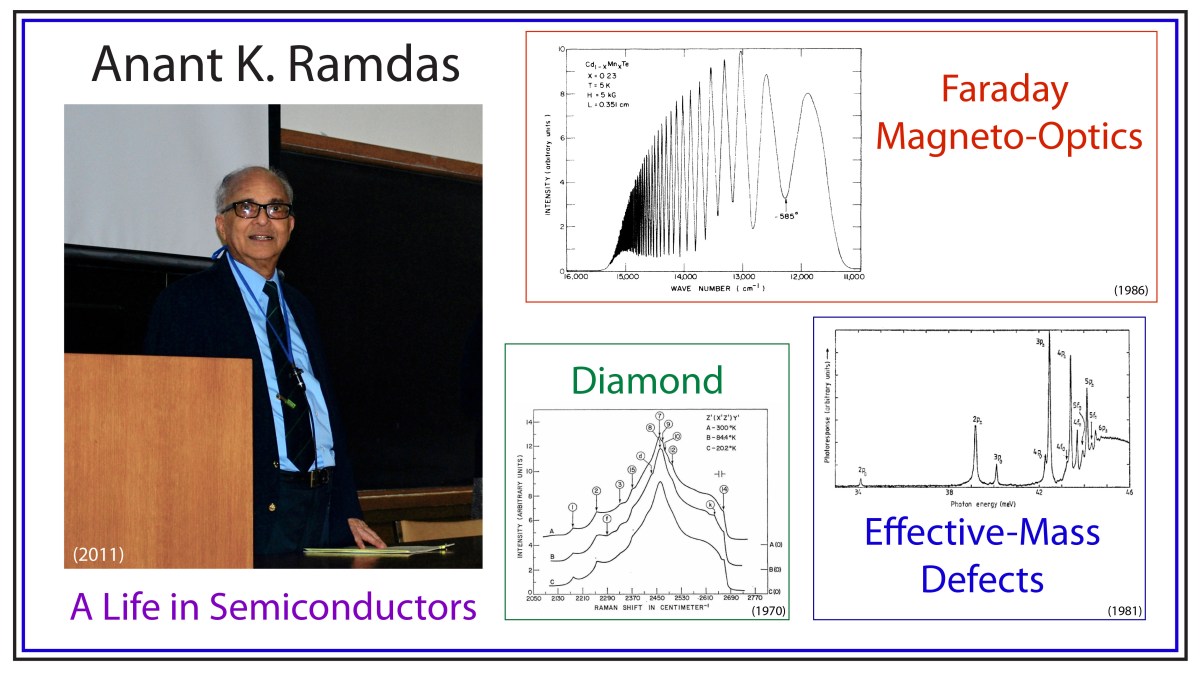
One of these quiet geniuses, of late, was a colleague of mine and a friend, Anant K. Ramdas.  He was the last PhD student of the Nobel Prize Laureate, C. V. Raman, and he may have been the last of his kind as a gentleman and a scholar physicist.
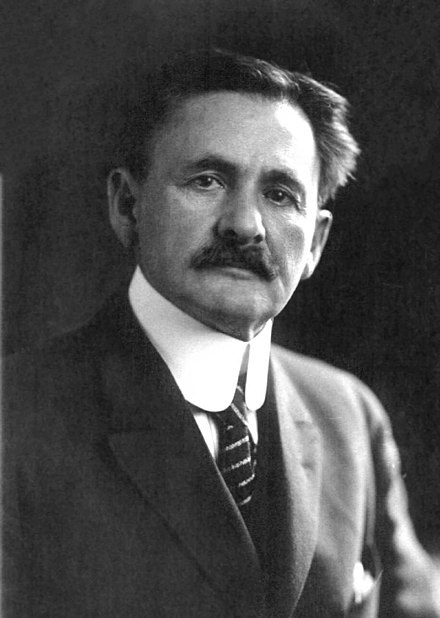
Anant K. Ramdas

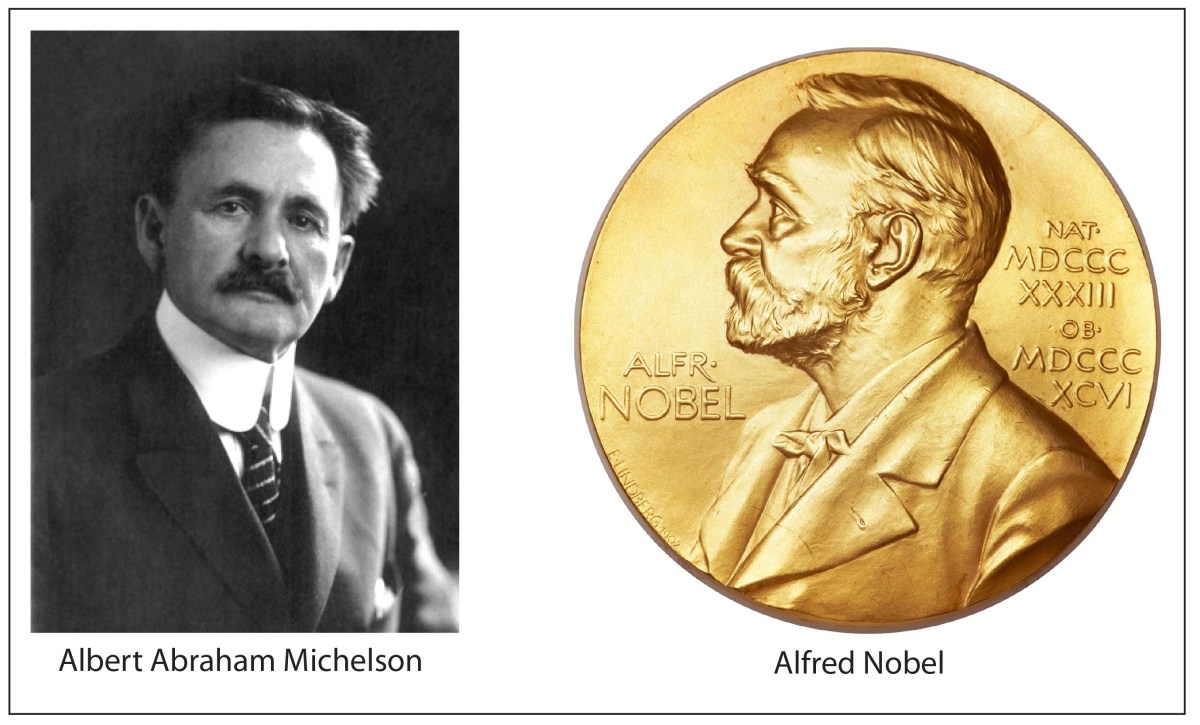
Anant Ramdas was born in May, 1930, in Pune, India, not far from the megalopolis of Mumbai when it had just over a million inhabitants (the number is over 22 million today, nearly a hundred years later).  His father, Lakshminarayanapuram A. Ramdas, was a scientist, a meteorologist who had studied under C. V. Raman at the University of Calcutta.  Raman won the Nobel Prize in Physics the same year that Anant Ramdas was born. 

Ramdas received his BS in Physics from the University of Pune in 1950, then followed in his father’s footsteps by studying for his MS (1953) and PhD (1956) degrees in Physics under Raman, who had established the Raman Institute in Bangalore, India. 

While facing the decision, after his graduation, on what to do and where to go, Ramdas read a review article published by Prof. H. Y. Fan of Purdue University on infrared spectroscopy of semiconductors.  After corresponding with Fan, and with the Purdue Physics department head, Prof. Karl Lark-Horowitz, Ramdas decided to accept the offer of a research associate (a post-doc position), and he prepared to leave India.

Within only a few months, he met and married his wife, Vasanti, and they hopped on a propeller plane to London that stopped along the way in Cairo, Beirut, Lebanon, and Paris before arriving in London.  From there, they caught a cargo ship making a two-week passage across the Atlantic, after stopping at ports in France and Portugal.  In New York City, they took a train to Chicago, getting off during a brief stop in the little corn-town of Lafayette, Indiana, home of Purdue University.  It was 1956, and Anant and Vasanti were, ironically, the first Indians that some people in the Indiana town had ever seen.

Semiconductor Physics at Purdue

Semiconductors became the ascendent electronic material during the Second World War when it was discovered that their electrical properties were ideal for military radar applications.  Many of the top physicists of the time worked at the “Rad Lab”, the Radiation Laboratory of MIT, and collaborations spread out across the US, including to the Physics Department at Purdue University.  Researchers at Purdue were especially good at growing the semiconductor Germanium, which was used in radar rectifiers.  The research was overseen by Lark-Horowitz.

After the war, semiconductor research continued to be a top priority in the Purdue Physics department as groups around the world competed to find ways to use semiconductors instead of vacuum tubes for information and control.  Friendly competition often meant the exchange of materials and samples, and sometime in early 1947, several Germanium samples were shipped to the group of Bardeen and Brattain at Bell Labs, where, several months later, they succeeded in making the first point contact transistor using Germanium (with some speculation today that it may have been with the samples sent from Purdue).  It was a close thing. Ralph Bray, a professor at Purdue, had seen nonlinear current dependences in the Purdue-grown Germanium samples that were precursers of transistor action, but Bell made the announcement before Bray had a chance to take the next step. Lark-Horowitz (and Bray) never forgot how close Purdue had come to making the invention themselves [1].

In 1948, Lark-Horowitz hired H. Y. Fan, who had received his PhD at MIT in 1937 and had been teaching at Tsinghua University in China.  Fan was an experimental physicist specializing in the infrared properties of semiconductors, and when Ramdas arrived at Purdue in 1956, he worked directly under Fan.  They published their definitive work on the infrared absorption of irradiated silicon in 1959 [2].

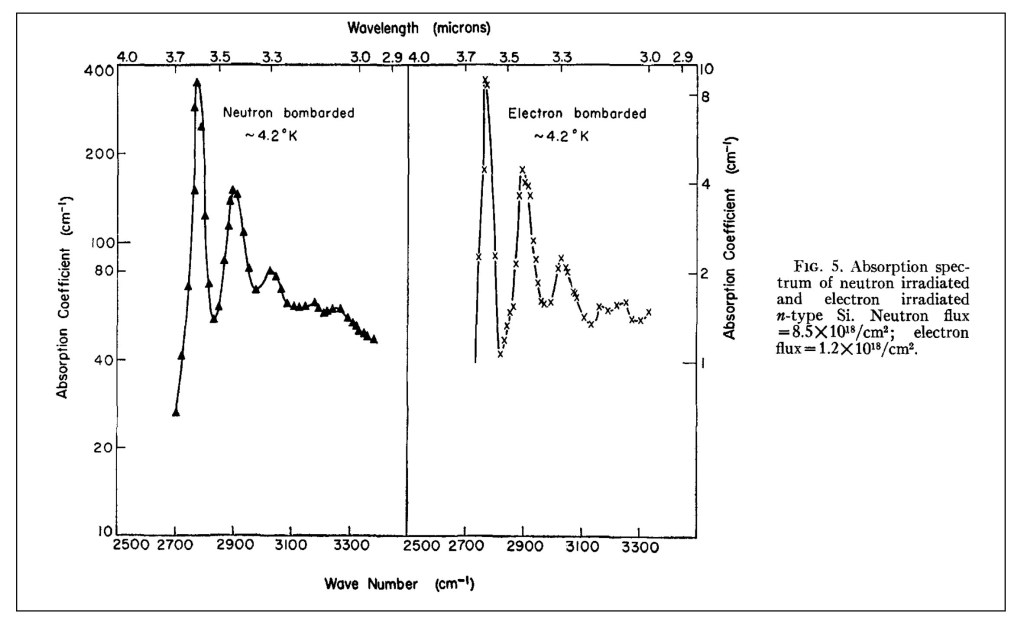
Absorption spectrum of “effective-mass” shallow defect levels in irradiated silicon.

One day, while Ramdas was working in Fan’s lab, Lark-Horowitz stopped by, as he was accustomed to do, and he casually asked if Ramdas would be interested in becoming a professor at Purdue.  Ramdas of course said “Yes”, and Lark-Horowitz gave him the job on the spot.  Ramdas was appointed as an assistant professor in 1960.  These things were less formal in those days, and it was only later that Ramdas learned that Fan had already made a strong case for him.

The Golden Age of Physics

The period from 1960 to 2015, which spanned Ramdas’ career, start to finish, might be called “The Golden Age of Physics”. 

This time span saw the completion of the Standard Model of particle physics with the theory of quarks (1964), the muon neutrino (1962), electro-weak unification (1968), quantum chromodynamics (1970s), the tau lepton (1975), the bottom quark (1977), the top quark (1995), the W and Z bosons (1983), the tau neutrino (2000), neutrino mass oscillations (2004), and of course capping it off with the detection of the Higgs boson (2012). 

This was the period in solid state physics that saw the invention of the laser (1960), the quantum Hall effect (1980), the fractional quantum Hall effect (1982), scanning tunneling microscopy (1981), quasi-crystals (1982), high-temperature superconductors (1986), and graphene (2005).

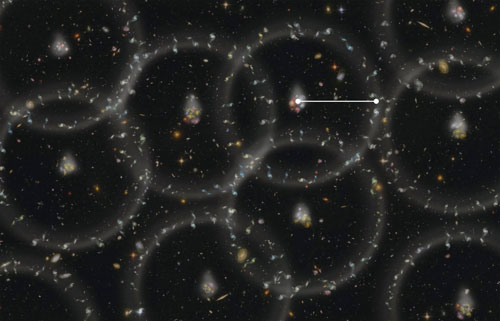
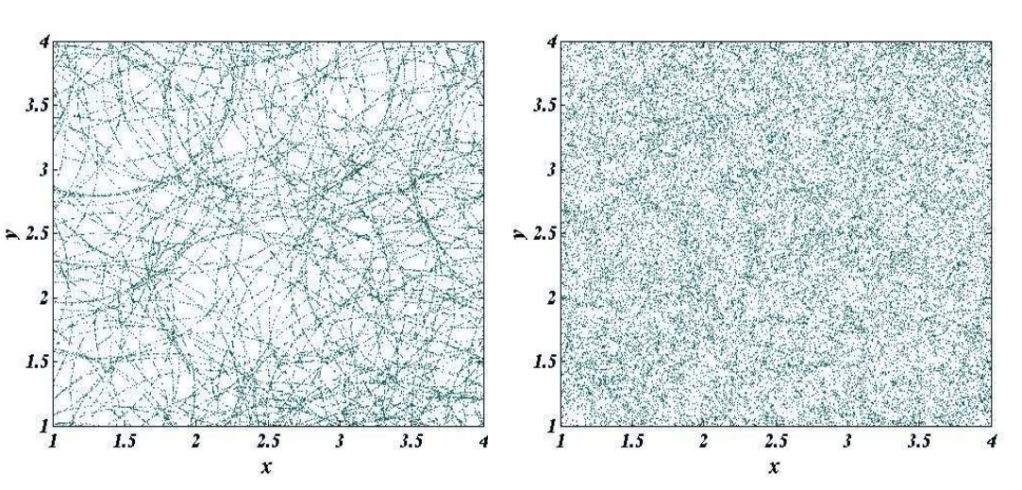
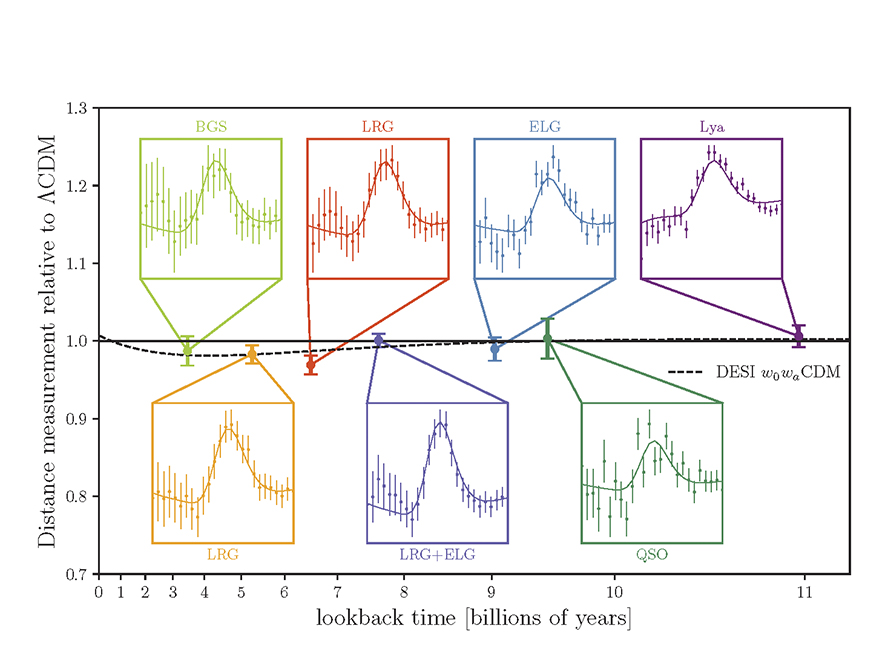
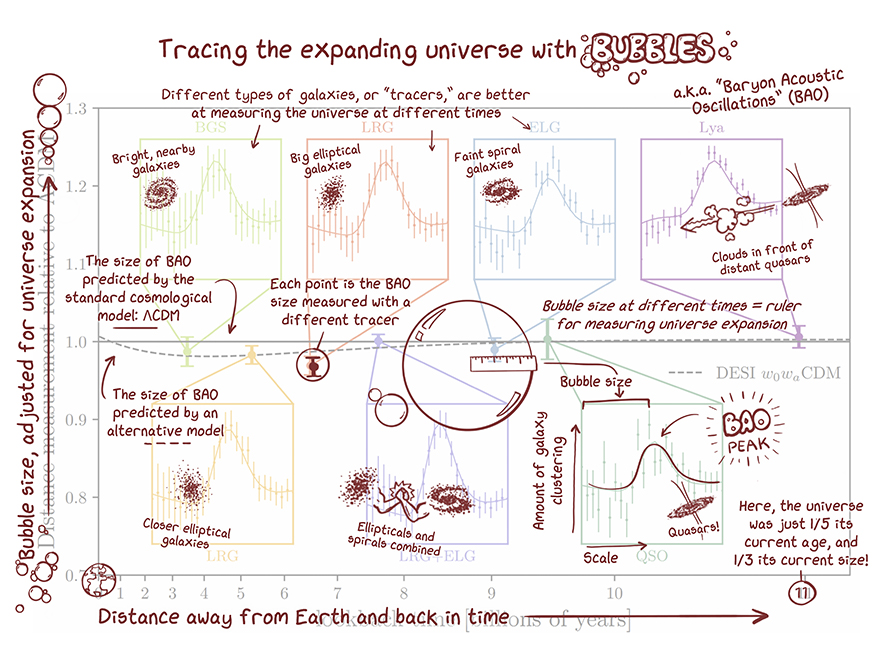
This was also the period when astrophysics witnessed the discovery of the Cosmic Background Radiation (1964), the first black hole (1964), pulsars (1967), confirmation of dark matter (1970s), inflationary cosmology (1980s), Baryon Acoustic Oscillations (2005), and capping the era off with the detection of gravitational waves (2015).

The period from 1960 – 2015 stands out relative to the “first” Golden Age of Physics from 1900 – 1930 because this later phase is when the grand programs from early in the century were brought largely to completion.

But these are the macro-events of physics from 1960-2015.  This era was also a Golden Age in the micro-events of the everyday lives of the physicists.  It is this personal aspect where this later era surpassed the earlier era (when only a handful of physicists were making progress).  In the later part of the century, small armies of physicists were advancing rapidly along all the frontiers at the same time, and doing it with the greatest focus.

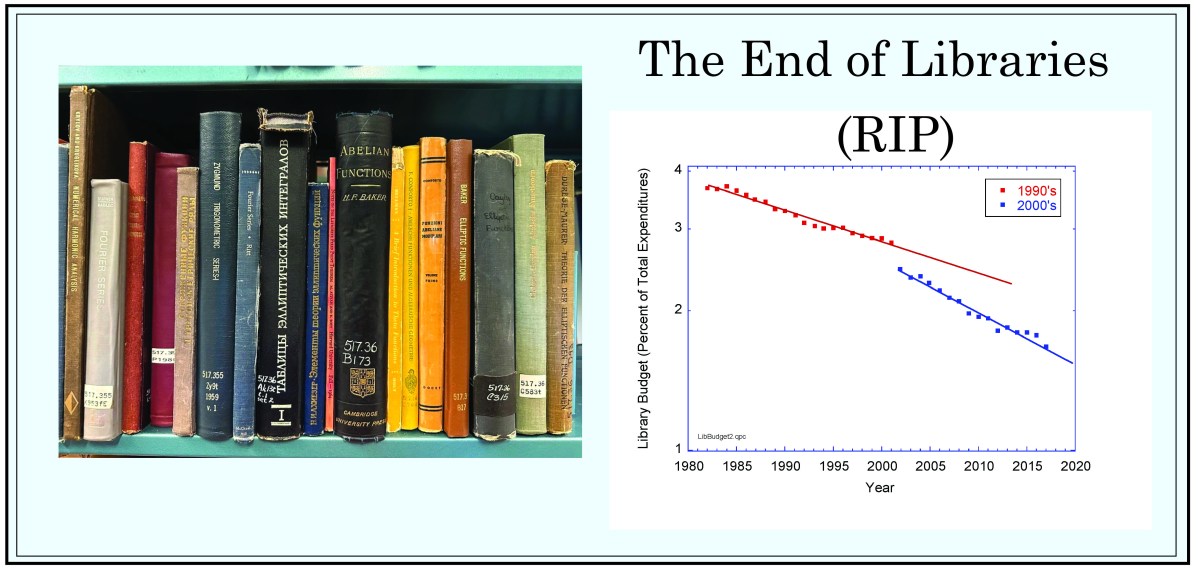
This was when a single NSF grant could support a single physicist with several grad students and an undergraduate or two.  The grants could be renewed with near certainty, as long as progress was made and papers were published.  Renewal applications, in those days, were three pages.  Contrast that to today when 25 pages need to be honed to perfection—and then the renewal rate is only about 10% (soon to be even lower with the recent budget cuts to science in the USA).  In those earlier days, the certainty of success, and the absence of the burden of writing multiple long grant proposals, bred confidence to dispose of the conventional, to try anything new.  In other words, the vast amount of time spent by physicists during this Golden Age was in the pursuit of physics, in the classroom and in the laboratory.

And this was the time when Anant Ramdas and his cohort—Sergio Rodriguez, Peter Fisher, Jacek Furdyna, Eugene Haller, the Chandrasekhar’s, Manuel Cardona, and the Dresselhaus’s—rode the wave of semiconductor physics when money was easy, good students were plentiful, and a vibrant intellectual community rallied around important problems.

Selected Topics of Research from Anant Ramdas

It is impossible to give justice to the breadth and depth of research performed by Anant over his career. So here is my selection of some of my favorite examples of his work:

Diamond

Anant had a life-long fascination for diamonds. As a rock and gem collector, he was fond of telling stories about the famous Cullinan diamond (weighed 1.3 pounds as a raw diamond at 3000 carats) and the blue Hope diamond (discovered in India). One of his earliest and most cited papers was on the Raman spectrum of Diamond [3], and he published several papers on his favorite color for diamonds—Blue [4]!

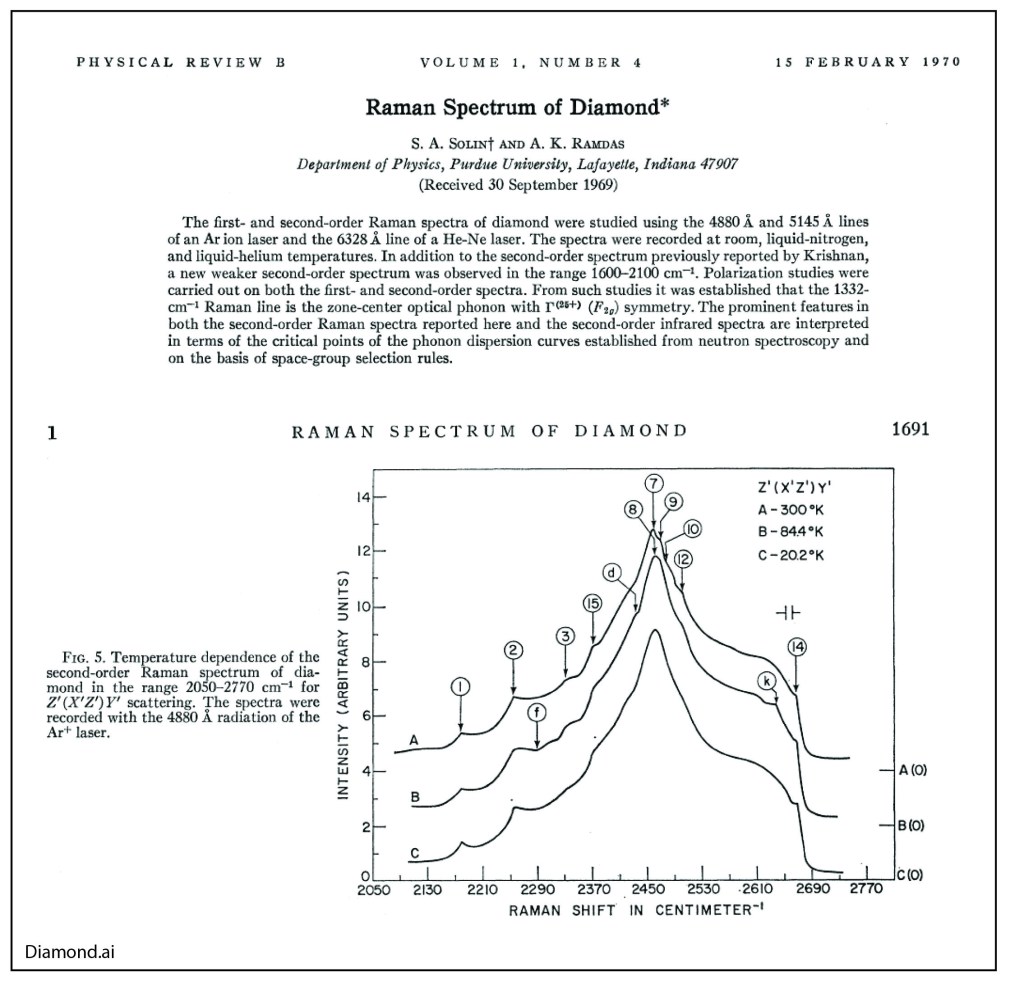
Raman Spectrum of Diamond.

His work on diamond helped endear Anant with the husband-wife team of Milly Dresselhaus and Gene Dresselhaus at MIT. Milly was the “Queen” of carbon, known for her work on graphite, carbon nanotubes and Fullerenes. Purdue had made an offer of an assistant professorship to Gene Dresselhaus when the two were looking for faculty positions after their post-docs at the University of Chicago, but Purdue would not give Milly a position (she was viewed as a “trailing” spouse). Anant was already at Purdue at that time and got to know both of them, maintaining a life-long friendship. Milly went on to become the president of the APS and was elected a member of the National Academy of Sciences, the National Academy of Engineering and the American Academy of Arts and Sciences.

Magneto-Optics

Purdue was a hot-bed of II-VI semiconductor research in the 1980’s, spearheaded by Jacek Furdyna. The substitution of the magnetic ion Mn for Zn, Cd or Hg created a unique class of highly magnetic semiconductors. Anant was the resident expert on the optical properties of the materials and collected one of the best examples of Giant Faraday Rotation [5].

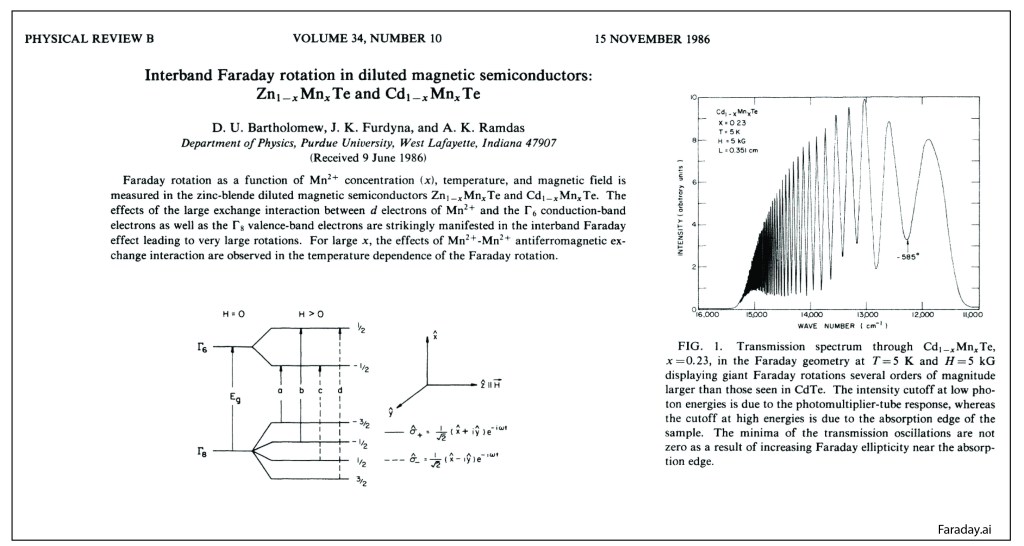
Giant Faraday Effect in CdMnTe

Anant and the Purdue team were the world leaders in the physics and materials science of diluted magnetic semiconductors.

Shallow Defects in Semiconductors

My own introduction to Anant was through his work on shallow effective-mass defect states in semiconductors. I was working towards my PhD with Eugene ‘Gene” Haller at Lawrence Berkeley Lab (LBL) in the early 1980’s, and Gene was an expert on the spectroscopy of the shallow levels in Germanium. My co-physics graduate student colleague was Joe Kahn, and the two of us were tasked with studying the review article that Anant had written with his long-time theoretical collaborator Sergio Rodriguez on the physics of effective-mass shallow defects in semiconductors [6]. We called it “The Bible”, and spent months studying it. Gene Haller’s principal technique was photothermal ionization spectroscopy (PTIS), and Joe was building the world’s finest PTIS instrument. Joe met Anant for dinner one night at the March meeting of the APS in 1986, and when he got back to the room, he waxed poetic about Anant for an hour. It was like he had met his hero. I don’t remember how I missed that dinner, so my personal introduction to Anant Ramdas would have to wait.

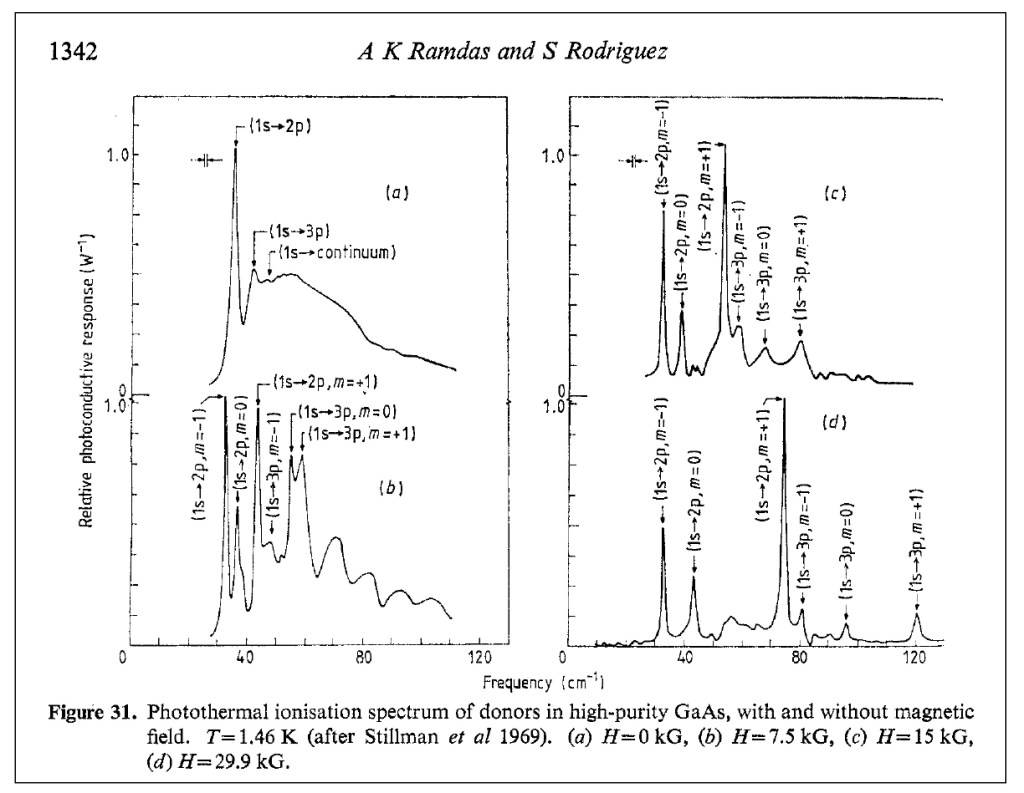
PTIS spectra of donors in GaAs

My own research went into deep-level transient spectroscopy (DLTS) working with Gene and his group theorist, Wladek Walukiewicz, where we discovered a universal pressure derivative in III-V semiconductors. This research led me to a post-doc position at Bell Labs under Alastair Glass and later to a faculty position at Purdue, where I did finally meet Anant, who became my long-time champion and mentor. But Joe had stayed with the shallow defects, and in particular defects that showed interesting dynamical properties, known as tunneling defects.

Dynamic Defects in Semiconductors

Dynamic defects in semiconductors are multicomponent defects (often involving vacancies or interstitial defects) in which one of the components tunnels quantum mechanically, or hops, rapidly on a time scale short compared to the measurement interaction time (electric dipole transition), so that the measurement sees increased symmetry compared to the instantaneous low-symmetry configuration of the defect.

Eugene Haller and his physics theory collaborator, Leo Falicov, were pioneers in tunneling defects related to hydrogen, building on earlier work by George Watkins who studied dynamical defects using EPR measurements. In my early days doing research under Eugene, we thought we had discovered a dynamical effect in FeB defects in silicon, and I spent two very interesting weeks at Lehigh University, visiting Watkins, to test out our idea, but it turned out to be a static effect. Later, Joe Kahn found that some of the early hydrogen defects in Germanium that Gene and Leo had proposed as dynamical defects were also, in fact, static. So the class of dynamical defects in semiconductors was actually shrinking over time rather than expanding. Joe did go on to find clear proof of a hydrogen-related dynamical defect in Germanium, saving the Haller-Falicov theory from the dust bin of Physics History.

In 2006 and in 2008, Ramdas was working on Oxygen-related defect complexes in CdSe when his student, G. Chen [7-8], discovered a temperature-induced symmetry raising. It showed clear evidence for a lower symmetry defect that converged into a higher symmetry mode at high temperatures, very much in agreement with the Haller-Falicov theory of dynamical symmetry raising.

At that time, I was developing my course notes for my textbook Introduction to Modern Dynamics, where some of the textbook problems in synchronization looked just like Anant’s data. Using a temperature-dependent coupling in a model of nonlinear (anharmonic) oscillators, I obtained the following fits (solid curves) to the Ramdas data (data points):

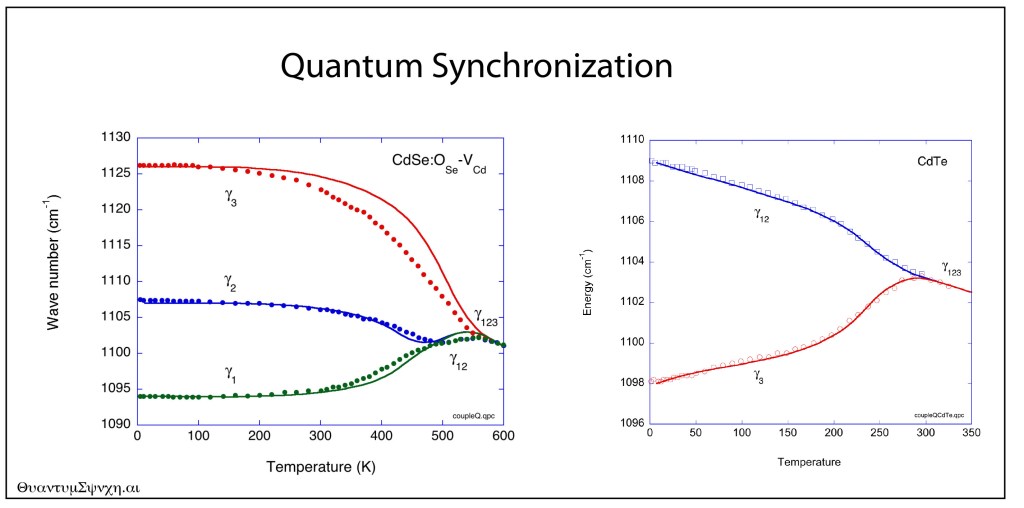
Quantum synchronization in CdSe and CdTe.

The fit looks too good to be a coincidence, and Anant and I debated on whether the Haller-Falicov theory, or a theory based on nonlinear synchronization, would be better descriptions of the obviously dynamical properties of these defects. Alas, Anant is now gone, and so are Gene and Leo, so I am the last one left thinking about these things.

Beyond the Golden Age?

Anant Ramdas was fortunate to have spent his career during the Golden Age of Physics, when the focus was on the science and on the physics, as healthy communities helped support one another in friendly competition. He was a gentleman scholar, an avid reader of books on history and philosophy, much of it (but not all) on the history and philosophy of physics. His “Coffee Club” at 9:30 AM every day in the Physics Department at Purdue was a must-not-miss event that was attended by all of the Old Guard as well as by myself, where the topics of conversation ran the gamut, presided over by Anant. He had his NSF grant, year after year (and a few others), and that was all he needed to delve into the mysteries of the physics of semiconductors.

Is that age over? Was Anant one of the last of that era? I can only imagine what he would say about the current war against science and against rationality raging across the USA right now, and the impending budget cuts to all the science institutes. He spent his career and life upholding the torch of enlightenment. Today, I fear he would be holding it in the dark. He passed away Thanksgiving, 2024.

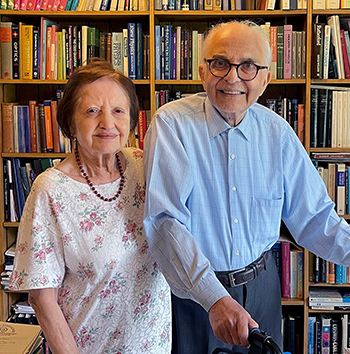
Vasanti and Anant, 2022.

References

[1] Ralph Bray, “A Case Study in Serendipity”, The Electrochemical Society, Interface, Spring 1997.

[2] H. Y. Fan and A. K. Ramdas, “INFRARED ABSORPTION AND PHOTOCONDUCTIVITY IN IRRADIATED SILICON,” Journal of Applied Physics, Article vol. 30, no. 8, pp. 1127-1134, 1959, doi: 10.1063/1.1735282.

[3] S. A. Solin and A. K. Ramdas, “RAMAN SPECTRUM OF DIAMOND,” Physical Review B, Article vol. 1, no. 4, pp. 1687-&, 1970, doi: 10.1103/PhysRevB.1.1687

[4] H. J. Kim, Z. Barticevic, A. K. Ramdas, S. Rodriguez, M. Grimsditch, and T. R. Anthony, “Zeeman effect of electronic Raman lines of accepters in elemental semiconductors: Boron in blue diamond,” Physical Review B, Article vol. 62, no. 12, pp. 8038-8052, Sep 2000, doi: 10.1103/PhysRevB.62.8038.

[5] D. U. Bartholomew, J. K. Furdyna, and A. K. Ramdas, “INTERBAND FARADAY-ROTATION IN DILUTED MAGNETIC SEMICONDUCTORS – ZN1-XMNXTE AND CD1-XMNXTE,” Physical Review B, Article vol. 34, no. 10, pp. 6943-6950, Nov 1986, doi: 10.1103/PhysRevB.34.6943.

[6] A. K. Ramdas and S. Rodriguez, “SPECTROSCOPY OF THE SOLID-STATE ANALOGS OF THE HYDROGEN-ATOM – DONORS AND ACCEPTORS IN SEMICONDUCTORS,” Reports on Progress in Physics, Review vol. 44, no. 12, pp. 1297-1387, 1981, doi: 10.1088/0034-4885/44/12/002

[7] G. Chen, I. Miotkowski, S. Rodriguez, and A. K. Ramdas, “Stoichiometry driven impurity configurations in compound semiconductors,” Physical Review Letters, Article vol. 96, no. 3, Jan 2006, Art no. 035508, doi: 10.1103/PhysRevLett.96.035508.

[8] G. Chen, J. S. Bhosale, I. Miotkowski, and A. K. Ramdas, “Spectroscopic Signatures of Novel Oxygen-Defect Complexes in Stoichiometrically Controlled CdSe,” Physical Review Letters, Article vol. 101, no. 19, Nov 2008, Art no. 195502, doi: 10.1103/PhysRevLett.101.195502.

Other Notable Papers:

[9] E. S. Oh, R. G. Alonso, I. Miotkowski, and A. K. Ramdas, “RAMAN-SCATTERING FROM VIBRATIONAL AND ELECTRONIC EXCITATIONS IN A II-VI QUATERNARY COMPOUND – CD1-X-YZNXMNYTE,” Physical Review B, Article vol. 45, no. 19, pp. 10934-10941, May 1992, doi: 10.1103/PhysRevB.45.10934.

[10] R. Vogelgesang, A. K. Ramdas, S. Rodriguez, M. Grimsditch, and T. R. Anthony, “Brillouin and Raman scattering in natural and isotopically controlled diamond,” Physical Review B, Article vol. 54, no. 6, pp. 3989-3999, Aug 1996, doi: 10.1103/PhysRevB.54.3989.

[11] M. H. Grimsditch and A. K. Ramdas, “BRILLOUIN-SCATTERING IN DIAMOND,” Physical Review B, Article vol. 11, no. 8, pp. 3139-3148, 1975, doi: 10.1103/PhysRevB.11.3139.

[12] E. S. Zouboulis, M. Grimsditch, A. K. Ramdas, and S. Rodriguez, “Temperature dependence of the elastic moduli of diamond: A Brillouin-scattering study,” Physical Review B, Article vol. 57, no. 5, pp. 2889-2896, Feb 1998, doi: 10.1103/PhysRevB.57.2889.

[13] A. K. Ramdas, S. Rodriguez, M. Grimsditch, T. R. Anthony, and W. F. Banholzer, “EFFECT OF ISOTOPIC CONSTITUTION OF DIAMOND ON ITS ELASTIC-CONSTANTS – C-13 DIAMOND, THE HARDEST KNOWN MATERIAL,” Physical Review Letters, Article vol. 71, no. 1, pp. 189-192, Jul 1993, doi: 10.1103/PhysRevLett.71.189.

.

How to Lose Weight by Supporting PBS and NPR

What is the point of education?  Why do we learn facts we never use in our jobs?  Why do we worry over tiny details in arcane classes that have no utility?  Isn’t it all a waste of time?

Let me ask it a different way.  Why not train for a specific job?  Can’t we jettison all those irrelevant facts and details and just spend our time on the activities we will be performing when we are employed?  Why bother with education in the first place?  Why not just get on with the job?

The answer is simple:  To adapt and to survive. Or even more simply: To live and to live well—which is the function of reason.

With a broad education, we learn how to learn, and we learn how to think.  We learn how to adapt, to be agile, to think differently.  We learn to recognize approaching pitfalls and opportunities.  We learn not to be afraid of the unknown.  We learn to be savvy and to know what’s what.

The world is changing faster and faster, and the worst thing we can do now is to stand still, hunkering down in our fox holes, waiting in vain for a lull in the barrage.  The lull never comes.  To live and to live well, we need the tools to shift, to pivot, to ride the wave of the new. 

That is what education allows us to do.

But even that is not enough.  We need to keep learning as the world changes.  Education never ends, and that is why we need the Public Broadcasting Service (PBS) and National Public Radio (NPR). 

These services are the fastest and easiest and cheapest ways to keep learning, to continue our education.  They expose us to the latest developments on topics, and in areas, we would never seek out for ourselves.  The volume and the value and the treasures and the tools they teach us are priceless.  They are our lifelines as we struggle not to go under as the waves of change crash down upon us.

Some of the topics suck.  No doubt.  And the news trends woke.  Clearly.  There are times when I regretted watching a disturbing PBS segment, and other times when I rushed to the radio to turn NPR off.  And that is the point—I am free to turn it off.  But it is still there when I choose to turn it on again. 

Governments have the responsibility to help their citizens live and to live well.  Continuing education is one simple and cheap way to do that.  The $1B that was cut by Congress yesterday from current funding of PBS and NPR costs about $7 per year per taxpayer.  That is a single Vente Mocha Frappuccino at Starbucks in one year.

Wouldn’t you give away one Vente Mocha Frappuccino per year just to have the option to turn on PBS or NPR?  You don’t even need to do it — just to have the option to? And you might even lose weight in the process.

Magister Mercator Maps the World (1569)

Gerardus Mercator was born in no-man’s land, in Flanders’ fields, caught in the middle between the Protestant Reformation and the Holy Roman Empire.  In his lifetime, armies washed back and forth over the countryside, sacking cities and obliterating the inhabitants.  At age 32 he was imprisoned by the Inquisition for heresy, though he had committed none, and languished for months as the authorities searched for the slimmest evidence against him.  They found none and he was released, though several of his fellow captives—elite academicians of their day—met their ends burned at the stake or beheaded or buried alive. It was not an easy time to be a scholar, with you and your work under persistent attack by political zealots.

Mercator received the degree of Magister, the degree in medieval universities that is equivalent to a Doctor of Philosophy … and then took what today we would call a “gap year” to “find himself” …

Yet in the midst of this turmoil and destruction, Mercator created marvels.  Originally trained for the Church, he was bewitched by cartography at a time when the known world was expanding rapidly after the discoveries of the New World.  Though the cognoscenti had known that the Earth was spherical since long before the Greeks, everyone saw it as flat, including cartographers, who in practice had to render it on flat maps.  When the world was local, flat maps worked well.  But as the world became global, new cartography methods were needed to capture the sphere, and Mercator entered the profession at just the moment when cartography was poised for a revolution.

Gerardus Mercator

The life of Gerardus Mercator (1512 – 1594) spanned nearly the full 16th century.  He was born 20 years after Colombus’ first voyage, and he died as Galileo began to study the law of fall, as Kepler began his study of planetary motion, and as Shakespeare began writing Romeo and Juliet.  Mercator was born in the town of Rupelmonde, Flanders, outside of Antwerp in the southern part of the Netherlands ruled by Hapsburg Spain.  His father was a poor shoemaker, but his uncle was an influential member of the clergy who paid for his nephew to attend a famous local school, in ‘s-Hertogenbosch, one where the humanist philosopher Erasmus (1466 – 1536) had attended several decades earlier. 

Mercator entered the University of Leuven in 1530 in the humanities where his friends included Andreas Vesalius (the future famous anatomist) and Antoine Granvelle (who would become one of the most powerful Cardinals of the era).  Mercator received the degree of Magister, the degree in medieval universities that is equivalent to a Doctor of Philosophy, in 1532, and then took what today we would call a “gap year” to “find himself” because he was having doubts about his faith and his future in the clergy.  It was during his gap year that he was introduced to cartography by the Franciscan friar Franciscus Monachus (1490 – 1565) at the Mechelen monastery situated between Antwerp and Brussels.

Returning to the University of Leuven in 1534, he launched himself into the physical sciences of geography and mathematics, for which he had no training, but he quickly mastered them under the tutelage of the Dutch mapmaker Gemma Frisius (1508 – 1555) at the university.  In 1537 Mercator completed his first map, a map of Palestine that received wide acclaim for its accuracy and artistry, and (more importantly) it sold well.  He had found his vocation.

Early Cartography

Maps are among the oldest man-made textual artefacts, dating to nearly 7000 BCE, several millennia before the invention of writing itself.  Knowing where things are, and where you are in relation to them, is probably the most important thing to remember in daily life.  Texts are memory devices, and maps are the oldest texts. 

The Alexandrian mathematician Claudius Ptolemy, around 150 CE, compiled a list of all the known world in his Geografia and drew up a map to accompany it.  It survived through Arabic translation and became a fixture in early medieval Europe where it remained a record of virtually all that was known until Christopher Columbus ran into the Caribbean Islands in 1492 on his way to China. Maps needed to be redrawn.

A pseudo-conic projection of the Mediterranean attributed to Ptolemy.
Fig. 1. A 1482 reproduction of the map of Ptolemy from 150 BCE. The known world had not expanded much in 1000 years. There is no bottom to Africa (the voyage of Bartolomeu Dias around the Cape of Good Hope came 6 years later) and no New World (Columbus’s first voyage was 10 years off).

The first map to show the new world was printed in 1500 by the Castillan navigator Juan de la Cosa, who had sailed with Columbus three times. His map included the explorations of John Cabot to the northern coasts.   

Portolan map by Juan de la Cosa.
Fig. 2. Juan de la Cosa’s 1500 map showing the new world as a single landmass (dark green on the left). Europe, Africa and Asia are outlined in light lettering in the center and right.

De la Cosa’s map was followed shortly by the world map of Martin Waldseemüller who named a small part of Brazil “America” in honor of Amerigo Vespucci who had just published an account of his adventures along the coasts of the new lands. 

The Waldseemüller map of 1507
Fig. 3. The Waldseemüller map of 1507 using “America” to name a part of current-day Brazil.

Leonardo da Vinci went further and created an eight-octant map of the globe around 1514, calling the entire new landmass “America”, expanding on Waldseemüller’s use of the name beyond merely Brazil.

The gores of Leonardo's world.
Fig. 4. The eight-octant globe found in the Leonardo codex in England. The globe is likely not by Leonardo’s own hand, but by one of his followers created sometime after 1507. The detail has far less than on the Waldseemüller map, but it is notable because it calls all of the New World “America”.

In 1538, just a year after his success with his Palastine map, Mercator created a map of the world that showed for the first time the separation of the Americas into two continents, the North and the South, expanding the name “America” to its full modern extent.

Mercator's 1538 map of the world.
Fig. 5. Mercator’s 1538 World Map showing North America and South America as separate continents. This is a “double cordiform” projection, which is a modified conical projection onto an internal cone with the apex at the Poles and the base at the Equator. The cone is split along the international date line (long before that was created). The Arctic is shown as an ocean while the Antarctic is shown as a continent (long before either of these facts were known).

These maps by the early cartographers were not functional maps for navigation, but were large, sometimes many feet across, meant to be displayed to advantage on the spacious walls in the rooms of the rich and famous.  On the other hand, since the late Middle Ages, there had been a long-standing tradition of map making among navigators whose lives depended on the utility and accuracy of their maps.  These navigational charts were called Portolan Charts, meaning literally charts of ports or harbors.  They carried sheaves of straight lines representing courses of constant magnetic bearing, meaning that the angle between the compass needle and the direction of the boat stayed constant. These are called rhumb lines, and they allowed ships to navigate between two known points beyond the sight of land.  The importance of rhumb lines far surpassed the use of decorative maps.  Mercator knew this, and for his next world map, he decided to give it rhumb lines that spanned the globe.  The problem was how to do it.

Portolan chart of the central Mediterranean.
Fig. 6. A Portolan Chart of the Mediterranean with Italy and Greece at the center, outlined by light lettering by the names of ports and bays. The straight lines are rhumb lines for constant-bearing navigation.

A Conformal Projection

Around the time that Mercator was bursting upon the cartographic scene, a Portuguese mathematician, Pedro Nunes, was studying courses of constant bearing upon a spherical globe.  These are mathematical paths on the sphere that were later called loxodromes, but over short distances, they corresponded to the rhumb line. 

Thirty years later, Mercator had become a master cartographer, creating globes along with scientific instruments and maps.  His globes were among the most precise instruments of their day, and he learned how to draw accurate loxodromes, following the work of Nunes.  On a globe, these lines became “curly cues” as they approached a Pole of the sphere, circling around the Pole in ever tighter circles that defied mathematical description (until many years later when Thomas Harriot showed they were logarithmic spirals).  Yet Mercator was a master draftsman, and he translated the curved loxodromes on the globe into straight lines on a world map.  What he discovered was a projection in which all lines of Longitude and all lines of Meridian were straight lines, as were all courses of constant bearing.  He completed his map in 1569, explicitly hawking its utility as a map that could be used on a global scale just as Portolan charts had been used in the Mediterranean.

Map of the North Atlantic by Gerard Mercator.
Fig. 7. A portion of Mercator’s 1569 World Map. The island just south of Thule (Iceland) is purely fictitious. Mercator has also filled in the Arctic Ocean with a new continent.
A segment of Mercator's 1569 map of the world.
Fig. 8. The Atlantic Ocean on Mercator’s 1569 map. Rhumb lines run true at all latitudes.

Mercator in 1569 was already established and famous and an old hand at making maps, yet even he was impressed by the surprising unity of his discovery.  Today, the Mercator projection is called a conformal map, meaning that all angles among intersecting lines on the globe are conserved in the planar projection, explaining the linear longitudes, latitudes and rhumbs.

The Geometry of Gerhardus Mercator

Mercator’s new projection is a convenient exercise in differential geometry. Begin with the transformation from spherical coordinates to Cartesian coordinates

where λ is the longitude and φ is the latitude. The Jacobian matrix is

Taking the transpose, and viewing each row as a new vector

creates the basis vectors of the spherical surface

A unit vector with constant heading at angle β is expressed in the new basis vectors as

and the path length and arc length along a constant-bearing path are related as

Equating common coefficients of the basis vectors gives

which is solved to yield the ordinary differential equation

This is integrated as

which is a logarithmic spiral.  The special function is called “the inverse Gundermannian”.  The longitude λ as a function of the latitude φ is solved as

To generate a Mercator rhumb, we only need to go back to a new set of Cartesian coordinates on a flat map

It is interesting to compare the Mercator projection to a conical projection onto a cylinder touching the sphere at its equator where the Mercator projection is

Equation for the Mercator projection.

while the conical projection onto the cylinder is

Clearly, the two projections are essentially the same around the Equator, but deviate exponentially approaching the Poles.

The Mercator projection has the conformal advantage, but it also has the disadvantage that landmasses at increasing latitude increase in size relative to their physical size on the glove.  Therefore, Greenland looks as big as Africa on a Mercator projection, while it is in fact only about the size of Texas.  The exaggerated sizes of countries in the upper latitudes (like the USA and Europe) relative to tropical countries near the equator has been viewed as creating an unfair psychological bias of first-world countries over third-world countries.  For this reason, Mercator projections are virtually never used today, with other map projections that retain relative sizes being now the most common. 

References


Crane, N. (2002), Mercator: The Man who Mapped the Planet, Weidenfeld & Nicolson, London.


Kythe, P. K. (2019), Handbook of Conformal Mappings and Applications, CRC Press.


Monmonier, M. S. (2004), Rhumb Lines and Map Wars: A Social History of the Mercator Projection, University of Chicago Press.


Snyder, J. P. (2002), Flattening the earth: Two thousand years of map projections, 5. ed ed., The University of Chicago Press, Chicago

Taylor, A. (2004), The World of Gerard Mercator: The Mapmaker Who Revolutionized Geography, Walker & Company, New York.

Read more in Books by David D. Nolte at Oxford University Press

Purge and Precipice: The Fall of American Science?

Let’s ask a really crazy question. As a pure intellectual exercise—not that it would ever happen—but just asking: What would it take to destroy American science? I know this is a silly question. After all, no one in their right mind would want to take down American science. It has been the guiding light in the world for the last 100 years, ushering in such technological marvels of modern life like transistors and the computer and lasers and solar panels and vaccines and immunotherapy and disease-resistant crops and such. So of course, American science is a National Treasure, more valuable than all the National Treasures in Washington, and no one would ever dream of attacking those.

But for the sake of argument, just to play Devil’s Advocate, what if someone with some power, someone who could make otherwise sensible people do his will, wanted to wash away the last 100 years of American leadership in Science? How would he do it?

The answer is obvious: Use science … and maybe even physics.

The laws of physics are really pretty simple: Cause and effect, action and reaction … those kinds of things. And modern physics is no longer about rocks thrown from cliffs, but is about the laws governing complex systems, like networks of people.

Can we really put equations to people? This was the grand vision of Isaac Asimov in his Foundation Trilogy. In that story, the number of people in a galaxy became so large that the behavior of the population as a whole could be explained by a physicist, Hari Seldon, using the laws of statistical mechanics. Asimov called it psychohistory.

It turns out we are not that far off today, and we don’t need a galaxy full of people to make it valid. But the name of the theory turns out to be a bit more prosaic than psychohistory: it’s called Network theory.

Network Theory

Network theory, at its core, is simply about nodes and links. It asks simple questions, like: What defines a community? What kind of synergy makes communities work? And when do things fall apart?

Science is a community.

In the United State, there are approximately a million scientists , 70% of whom work in industry with 20% in academia and 10% in government (at least, prior to 2025). Despite the low fraction employed in academia, all scientists and engineers received their degrees from universities and colleges and many received post-graduate training at those universities and at national labs like Los Alamos and the NIH labs in Washington. These are the backbone of the American scientific community, these are the hubs from which the vast network of scientists connect out across the full range of industrial and manufacturing activities that drive 70% of the GDP of the United States. The universities and colleges are also reservoirs for long-term science knowledge that can be tapped at a moment’s notice by industry when it pivots to new materials or new business models.

In network theory, hubs hold the key to the performance of the network. In technical terms, hubs have high average degree, which means that hubs connect to a large fraction of the total network. This is why hubs are central to network health and efficiency. Hubs also are the main cause of the “Small World Effect”, which states that everyone on a network is only a few links away from anyone else. This is also known as “Six degrees of Separation”, because in even vast networks that span the country, it only takes about 6 friends of friends of friends of friends of friends of friends before you connect to any given person. The world is small because you know someone who is a hub, and they know everyone else. This is a fundamental result of network theory, whether the network is of people, or servers, or computer chips.

Having established how important hubs are to network connectivity, it is clear that the disproportionate importance of hubs make them a disproportionate target for network disruption. For instance, in the power grid, take down a large central switching station and you can take down the grid over vast portions of the country. The same is true for science and the science community. Take down a few of the key pins, and the whole network can collapse—a topic of percolation theory.

Percolation and Collapse

Percolation theory says what it does––it tells when a path on a network is likely to “percolate” across it—like water percolating through coffee grounds. For a given number of nodes N, there needs to be enough links so that most of the nodes belong to the largest connected cluster. Then most starting paths can percolate across the whole network. On the other hand, if enough links are broken, then the network breaks apart into a lot of disconnected clusters, and you cannot get from one to the others.

Percolation theory says a lot about the percolation transition that occurs at the percolation threshold—which describes how the likelihood of having a percolating path across a network rises and falls as the number of links in the network increases or decreases. It turns out that for large networks, this transition from percolating to non-percolating is abrupt. When there are just barely enough links to keep the network connected, then removing just one link can separate it into disconnected clusters. In other words, the network collapses.

Therefore, network collapse can be sudden and severe. It is even possible to be near the critical percolation condition and not know it. All can seem fine, with plenty of paths to choose from to get across the network—then lose just a few links—and suddenly the network collapses into a bunch of islands. This is sometimes known as a tipping point—also as a bifurcation or as a catastrophe. Tipping points, bifurcations and percolation transitions get a lot of attention in network theory, because they are sudden and large events that can occur with little forewarning.

So the big question for this blog is: What would it take to have the scientific network of the United States collapse?

Department of Governmental Exterminations (DOGE)

The head of DOGE is a charismatic fellow, and like the villain of Jane Austen’s Pride and Prejudice, he was initially a likable character. But he turned out to be an arbiter of chaos and a cad. No one would want to be him in the end. The same is true in our own Austenesque story of Purge and Precipice: As DOGE purges, we approach the precipice.

Falling off a cliff is easy, because if a network has hubs, and those hubs have a disproportionate importance to keeping the network together, then an excellent strategy to destroy the network would be to randomly take out the most important hubs.

If the hubs of the scientific network across the US are the universities and colleges and government labs, then attack those, even though they only hold 20% to 30% of the scientists in the country, you can bring science to a standstill in the US by breaking apart the network into isolate islands. Alternatively, when talking about individuals in a network, the most important hubs are the scientists who are the repositories of the most knowledge—the elder statesmen of their fields—the ones you can get to buy out and retire.

Networks with strongly connected hubs are the most vulnerable to percolation collapse when the hubs are attacked specifically.

Science Network Evolving under Reduction in Force through Natural Attrition

Fig. 1 Healthy network evolving under a 15% reduction in force (RIF) through natural retirement and attrition.

This simulation looks at a reduction in force (RIF) of 15% and its effect on a healthy interaction network. It uses a scale-free network that evolves in time as individuals retire naturally or move to new jobs. When a node is removed from the net, it becomes a disconnected dot in the video. Other nodes that were “orphaned” by the retirement are reassigned to existing nodes. Links represent scientific interactions or lines of command. A few links randomly shift as interests change. Random retirements might hit a high-degree node (a hub), but the event is rare enough that the natural rearrangements of the links continue to keep the network connected and healthy as it adapts to the loss of key opinion leaders.

Science Network under DOGE Attack

Fig. 2 An attack on the high-degree nodes (the hubs) of the network, leading to the same 15% RIF as Fig. 1. The network becomes fragmented and dysfunctional.

Universities and government laboratories are high-degree nodes that have a disproportionate importance to the Science Network. By targeting these nodes, the network rapidly disintegrates. The effect is too drastic for the rearrangement of some links to fix it.

The percolation probability of an interaction network, like the Science Network, is a fair measure of scientific productivity. The more a network is interconnected, the more ideas flow across the web, eliciting new ideas and discoveries that often lead to new products and growth in the national GDP. But a disrupted network has low productivity. The scientific productivity is plotted in Fig. 3 as a function of the reduction in force up to 15%. Natural attrition can attain this RIF with minimal impact on the productivity of the network measured through its percolation probability. However, targeted attacks on the most influential scientific hubs rapidly degrades the network, breaking it apart into lots of disconnected clusters. There is no free flow of ideas and lost opportunities for new products and eventual erosion of the national GDP.

Fig. 3 Scientific productivity, measured by the percolation probability across the network, as a function of the reduction in force up to 15%. Natural attrition keeps most of the productivity high. Targeted attacks on the most influential science institutions decimate the Science Network.

It takes about 15 years for scientific discoveries to establish new products in the market place. Therefore, a collapse of American science over the next few years won’t be fully felt until around the year 2040. All the politicians in office today will be long gone by then (let’s hope!), so they will never get the blame. But our country will be poorer and weaker, and our lives will be poorer and sicker—the victims of posturing and grandstanding for no real benefit other than the fleeting joy of wrecking what was built over the past century. When I watch the glee of the Perp in Chief and his henchmen as they wreak their havoc, I am reminded of “griefers” in Minecraft.

The Upshot

One of the problems with being a physicist is that sometimes you see the train wreck coming.

I see a train wreck coming.

PostScript

It is important not to take these simulations too literally as if they were an accurate numerical model of the Science Network in the US. The point of doing physics is not to fit all the parameters—that’s for the engineers. The point of doing physics is to recognize the possibilities and to see the phenomena—as well as the dangers.

Take heed of the precipice. It is real. Are we about to go over it? It’s hard to tell. But should we even take the chance?

Frontiers of Physics (2024): Dark Energy Thawing

At the turn of the New Year, as I turn to the breakthroughs in physics of the previous year, sifting through the candidates, I usually narrow it down to about 4 to 6 that I find personally compelling (See, for instance 2023, 2022). In a given year, they may be related to things like supersolids, condensed atoms, or quantum entanglement. Often they relate to those awful, embarrassing gaps in physics knowledge that we give euphemistic names to, like “Dark Energy” and “Dark Matter” (although in the end they may be neither energy nor matter). But this year, as I sifted, I was struck by how many of the “physics” advances of the past year were focused on pushing limits—lower temperatures, more qubits, larger distances.

If you want something that is eventually useful, then engineering is the way to go, and many of the potential breakthroughs of 2024 did require heroic efforts. But if you are looking for a paradigm shift—a new way of seeing or thinking about our reality—then bigger, better and farther won’t give you that. We may be pushing the boundaries, but the thinking stays the same.

Therefore, for 2024, I have replaced “breakthrough” with a single “prospect” that may force us to change our thinking about the universe and the fundamental forces behind it.

This prospect is the weakening of dark energy over time.

It is a “prospect” because it is not yet absolutely confirmed. If it is confirmed in the next few years, then it changes our view of reality. If it is not confirmed, then it still forces us to think harder about fundamental questions, pointing where to look next.

Einstein’s Cosmological “Constant”

Like so much of physics today, the origins of this story go back to Einstein. At the height of WWI in 1917, as Einstein was working in Berlin, he “tweaked” his new theory of general relativity to allow the universe to be static. The tweak came in the form of a parameter he labelled Lambda (Λ), providing a counterbalance against the gravitational collapse of the universe, which at the time was assumed to have a time-invariant density. This cosmological “constant” of spacetime represented a pressure that kept the universe inflated like a balloon.

Fig. 1 Einstein’s “Field Equations” for the universe containing expressions for curvature, the metric tensor and energy density. Spacetime is warped by energy density, and trajectories within the warped spacetime follow geodesic curves. When Λ = 0, only gravitional attraction is present. When Λ ≠ 0, a “repulsive” background force exerts a pressure on spacetime, keeping it inflated like a balloon.

Later, in 1929 when Edwin Hubble discovered that the universe was not static but was expanding, and not only expanding, but apparently on a free trajectory originating at some point in the past (the Big Bang), Einstein zeroed out his cosmological constant, viewing it as one of his greatest blunders.

And so it stood until 1998 when two teams announced that the expansion of the universe is accelerating—and Einstein’s cosmological constant was back in. In addition, measurements of the energy density of the universe showed that the cosmological constant was contributing around 68% of the total energy density, which has been given the name of Dark Energy. One of the ways to measure Dark Energy is through BAO.

Baryon Acoustic Oscillations (BAO)

If the goal of science communication is to be transparent, and to engage the public in the heroic pursuit of pure science, then the moniker Baryon Acoustic Oscillations (BAO) was perhaps the wrong turn of phrase. “Cosmic Ripples” might have been a better analogy (and a bit more poetic).

In the early moments after the Big Bang, slight density fluctuations set up a balance of opposing effects between gravitational attraction, that tends to clump matter, and the homogenization effects of the hot photon background, that tends to disperse ionized matter. Matter consists of both dark matter as well as the matter we are composed of, known as baryonic matter. Only baryonic matter can be ionized and hence interact with photons, hence only photons and baryons experience this balance. As the universe expanded, an initial clump of baryons and photons expanded outward together, like the ripples on a millpond caused by a thrown pebble. And because the early universe had many clumps (and anti-clumps where density was lower than average), the millpond ripples were like those from a gentle rain with many expanding ringlets overlapping.

Fig. 2 Overlapping ripples showing galaxies formed along the shells. The size of the shells is set by the speed of “sound” in the universe. From [Ref].
Fig. 3 Left. Galaxies formed on acoustic ringlets like drops of dew on a spider’s web. Right. Many ringlets overlapping. The characteristic size of the ringlets can still be extracted statistically. From [Ref].

Then, about 400,000 years after the Big Bang, as the universe expanded and cooled, it got cold enough that ionized electrons and baryons formed atoms that are neutral and transparent to light. Light suddenly flew free, decoupled from the matter that had constrained it. Removing the balance between light and matter in the BAO caused the baryonic ripples to freeze in place, as if a sudden arctic blast froze the millpond in an instant. The residual clumps of matter in the early universe became clumps of galaxies in the modern universe that we can see and measure. We can also see the effects of those clumps on the temperature fluctuations of the cosmic microwave background (CMB).

Between these two—the BAO and the CMB—it is possible to measure cosmic distances, and with those distances, to measure how fast the universe is expanding.

Acceleration Slowing

The Dark Energy Spectroscopic Instrument (DESI) on top of Kitt Peak in Arizona is measuring the distances to millions of galaxies using automated fiber optic arrays containing thousands of optical fibers. In one year it measured the distances to about 6 milliion galaxies.

Fig. 4 The Kitt Peak observatory, the site of DESI. From [Ref].

By focusing on seven “epochs” in galaxy formation in the universe, it measures the sizes of the BAO ripples over time, ranging in ages from 3 billion to 11 billion years ago. (The universe is about 13.8 billion years old.) The relative sizes are then compared to the predictions of the LCDM (Lambda-Cold-Dark-Matter) model. This is the “consensus” model of the day—agreed upon as being “most likely” to explain observations. If Dark Energy is a true constant, then the relative sizes of the ripples should all be the same, regardless of how far back in time we look.

But what the DESI data discovered is that relative sizes more recently (a few billion years ago) are smaller than predicted by LCDM. Given that LCDM includes the acceleration of the expansion of the universe caused by Dark Energy, it means that Dark Energy is slightly weaker in the past few billion years than it was 10 billion years ago—it’s weakening or “thawing”.

The measurements as they stand today are shown in Fig. 5, showing the relative sizes as a function of how far back in time they look, with a dashed line showing the deviation from the LCDM prediction. The error bars in the figure are not yet are that impressive, and statistical effects may be causing the trend, so it might be erased by more measurements. But the BAO results have been augmented by recent measurements of supernova (SNe) that provide additional support for thawing Dark Energy. Combined, the BAO+SNe results currently stand at about 3.4 sigma. The gold standard for “discovery” is about 5 sigma, so there is still room for this effect to disappear. So stay tuned—the final answer may be known within a few years.

Fig. 5 Seven “epochs” in the evolution of galaxies in the universe. This plot shows relative galactic distances as a function of time looking back towards the Big Bang (older times closer to the Big Bang are to the right side of the graph). In more recent times, relative distances are smaller than predicted by the consensus theory known as Lambda-Cold-Dark-Matter (LCDM), suggesting that Dark Energy is slight weaker today than it was billions of years ago. The three left-most data points (with error bars from early 2024) are below the LCDM line. From [Ref].
Fig. 6 Annotated version of the previous figure. From [Ref].

The Future of Physics

The gravitational constant G is considered to be a constant property of nature, as is Planck’s constant h, and the charge of the electron e. None of these fundamental properties of physics are viewed as time dependent and none can be derived from basic principles. They are simply constants of our reality. But if Λ is time dependent, then it is not a fundamental constant and should be derivable and explainable.

And that will open up new physics.

Science Underground: Neutrino Physics and Deep Gold Mines

“By rights, we shouldn’t even be here,” says Samwise Gamgee to Frodo Baggins in the Peter Jackson movie The Lord of the Rings: The Two Towers

But we are!

We, our world, our Galaxy, our Universe of matter, should not exist.  The laws of physics, as we currently know them, say that all the matter created at the instant of the Big Bang should have annihilated with all the anti-matter there too.  The great flash of creation should have been followed by a great flash of destruction, and all that should be left now is a faint glow of light without matter.

Except that we are here, and so is our world, and our Galaxy and our Universe … against the laws of physics as we know them.

So, there must be more that we have yet to know.  We are not done yet with the laws of physics.

Which is why the scientists of the Sanford Underground Research Facility (SURF), a kilometer deep under the Black Hills of South Dakota, are probing the deep questions of the universe near the bottom of a century-old gold mine.

Homestake Mine

>>> Twenty of us are plunging vertically at one meter per second into the depths of the earth, packed into a steel cage, seven to a row, dressed in hard hats and fluorescent safety vests and personal protective gear plus a gas filter that will keep us alive for a mere 60 minutes if something goes very wrong.  It is dark, except for periodic fast glimpses of LED-lit mine drifts flying skyward, then rock again, repeating over and over for ten minutes.  Drops of water laced with carbonate drip from the cage ceiling, that, when dried, leave little white stalagmites on our clothing.  A loud bang tells everyone inside that a falling boulder has crashed into the top of the cage, and we all instinctively press our hard hats more tightly onto our heads.  Finally, the cage slows, eventually to a crawl, as it settles to the 4100 level of the Homestake mine. <<<

The Homestake mine was founded in 1877 on land that had been deeded for all time to the Lakota Sioux by the United States Government in the Treaty of Fort Laramie in 1868—that is, before George Custer, twice cursed, found gold in the rolling forests of Ȟe Sápa—the Black Hills, South Dakota.  The prospectors rushed in, and the Lakota were pushed out.

Gold was found washed down in the streams around the town of Deadwood, but the source of the gold was found a year later at the high Homestake site by prospectors.  The stake was too large for them to operate themselves, so they sold it to a California consortium headed by George Hearst, who moved into town and bought or stole all the land around it.  By 1890, the mine was producing the bulk of gold and silver in the US.  When George Hearst died in 1891, his wife Phoebe donated part of the fortune to building projects at the University of California at Berkeley, including the Hearst Mining Building, which was the largest building devoted to the science of mining engineering in the world.  Their son, William Randolph Hearst, became a famous newspaper magnate and a possible inspiration for Orson Well’s Citizen Cane.

The interior of Hearst Mining Building, UC Berkeley campus.

By the late 1900’s, the mining company had excavated over 300 miles of tunnels and extracted nearly 40 million ounces of gold (equivalent to $100B today).  Over the years, the mine had gone deeper and deeper, eventually reaching the 8000 foot level (about 3000 feet below sea level). 

This unique structure presented a unique opportunity for a nuclear chemist, Ray Davis, at Brookhaven National Laboratory who was interested in the physics of neutrinos, the elementary particles that Enrico Fermi had named the “little neutral ones” that accompany radioactive decay. 

Neutrinos are unlike any other fundamental particles, passing through miles of solid rock as if it were transparent, except for exceedingly rare instances when a neutrino might collide with a nucleus.  However, neutrino detectors on the surface of the Earth were overwhelmed by signals from cosmic rays.  What was needed was a thick shield to protect the neutrino detector, and what better shield than thousands of feet of rock? 

Davis approached the Homestake mining company to request space in one of their tunnels for his detector.  While a mining company would not usually be receptive to requests like this, one of its senior advisors had previously had an academic career at Harvard, and he tipped the scales in favor of Davis.  The experiment would proceed.

The Solar Neutrino Problem

>>> After we disembark onto the 4100 level (4100 feet below the surface) from the Ross Shaft, we load onto the rail cars of a toy train, the track width little more than a foot wide.  The diminutive engine clunks and clangs and jerks itself forward, gathering speed as it pushes and pulls us, disappearing into a dark hole (called a drift) on a mile-long trek to our experimental site.  Twice we get stuck, the engine wheels spinning without purchase, and it is not clear if the engineers can get it going again. 

At this point we have been on the track for a quarter of an hour and the prospect of walking back to the Ross is daunting.  The only other way out, the Yates Shaft, is down for repairs.  The drift is unlit except by us with our battery-powered headlamps sweeping across the rock face, and who knows how long the batteries will last?  The ground is broken and uneven, punctuated with small pools of black water.  There would be a lot of stumbling and falls if we had to walk our way out.  I guess this is why I had to initial and sign in twenty different places on six pages, filled with legal jargon nearly as dense as the rock around us, before they let me come down here. <<<

In 1965, the Homestake mining crews carved out a side cavern for Davis near the Yates shaft at the 4850 level of the mine.  He constructed a large vat to hold cleaning fluid that contained lots of chlorine atoms.  When a rare neutrino interacted with a chlorine nucleus, the nucleus would convert to argon and give off a characteristic flash of light.  By tallying the flashes of light, and by calculating how likely it was for a neutrino to interact with a nucleus, the total flux of neutrinos through the vat could be back calculated.

The main source for neutrinos in our neck of the solar system is the sun.  As hydrogen fuses into helium, it gives off neutrinos.  These pass through the overlying layers of the sun and pass through the Earth and through Davis’ vat—except those rare cases when chlorine converts to argon.  The rate at which solar neutrinos should be detected in the vat was calculated very accurately by John Bahcall at Cal Tech.

By the early 1970’s, there were enough data that the total neutrino flux could be calculated and compared to the theoretical value based on the fusion reactions in the sun—and they didn’t match.  Worse, they didn’t match within a factor of three!  There were three times fewer neutrino events detected that there should have been.  Where were all the missing neutrinos?

Origins and fluxes of solar neutrinos.

This came to be called the “Solar neutrino problem”.  At first, everyone assumed that the experiment was wrong, but Davis knew he was right.  Then others said the theoretical values were wrong, but Bahcall knew he was right.  The problem was, that Davis and Bahcall couldn’t both be right, could they?

Enter neutrino oscillations

The neutrinos coming from the sun originate mostly as what are known as electron neutrinos.  These interact with a neutron in a chlorine nucleus to convert it to a proton plus an ejected electron.  But if the neutrino were of a different kind, perhaps a muon neutrino, then there isn’t enough energy for the neutron to eject a muon, so the reaction doesn’t take place. 

Hydrogen fusion in the sun.

This became the leading explanation for the missing solar neutrinos.  If many of them converted to muon neutrinos on their way to the Earth, then the Davis experiment wouldn’t detect them—hence the missing events.

The way that neutrinos can oscillate from electron neutrinos to muon neutrinos is if neutrinos have a very small but finite mass.  This was the solution, then, to the solar neutrino problem.  Neutrinos have mass.  Ray Davis was awarded the Nobel Prize in Physics in 2002 for his discovery of the missing neutrinos.

But one solution begets another problem: the Standard Model of elementary particles says that neutrinos are massless.  What can be going on with the Standard Model?

Once again, the answer may be found deep underground.

Sanford Underground Research Facility (SURF)

>>> The rock of the Homestake is one of the hardest and densest rocks you will find, black as night yet shot through with white streaks of calcite like the tails of comets.  It is impermeable, and despite being so deep, the rock is surprisingly dry—most of the fractures are too tight to allow a trickle through. 

As our toy train picks up speed, the veins flash by in our headlamps, sometimes sparkling with pin pricks of reflected light.  A gold fleck perhaps?  Yet the drift as a whole (or as a hole) is a shabby thing, rusty wedges half buried in the ceiling to keep slabs from falling, bent and battered galvanized metal pinned to the walls by rock bolts to hold them back, flimsy metal webbing strung across the ceiling to keep boulders from crushing our heads.  It’s dirty and dark and damp and hewn haphazardly from the compressed crust.  There is no art, no sense of place.  These shafts were dynamited through, at three-to-five feet per detonation, driven by money and the need for the gold, so nobody had any sense of aesthetics. <<<

The Homestake mine closed operations in 2001 due to the low grade of ore and the sagging price of gold.  They continued pumping water from the mine for two more years in anticipation of handing the extensive underground facility over to the National Science Foundation for use as a deep underground science lab.  However, delays in the transfer and the cost of pumping forced them to turn off the pumps and the water slowly began rising through the levels, taking a year or more to rise and flood the famous 4850 level while negotiations continued. 

The surface buildings of the Sanford Underground Research Facility (SURF).
The open pit at Homestake.

Finally, the NSF took over the facility to house the Deep Underground Science and Engineering Laboratory (DUSEL) that would operate at the deepest levels, but these had already been flooded.  After a large donation from South Dakota banker T. Denny Sanford and support from the Governor Mike Rounds, the facility became the Sanford Underground Research Fability (SURF).  The 4850 level was “dewatered”, and the lab was dedicated in 2009.  But things were still not settled.  NSF had second thoughts, and in 2011 the plans for DUSEL (still under water) were terminated and the lab was transferred to the Department of Energy (DOE), administered through the Lawrence Berkeley National Laboratory, to host experiments at the 4850 level and higher.

Layout of the mine levels at SURF.

Two early experiments at SURF were the Majorana Demonstrator and LUX. 

The Majorana Demonstrator was an experiment designed to look for neutrino-less double-beta decay where two neutrons in a nucleus decay simultaneously, each emitting a neutrino. A theory of neutrinos proposed by the Italian physicist, Ettore Marjorana, in 1937 that goes beyond the Standard Model ,says that a neutrino is its own antiparticle. If this were the case, then the two neutrinos emitted in the double beta decay could annihilate each otherhence a “neutrinoless” double beta decay. The Demonstrator was too small to actually see such an event, but it tested the concept and laid the ground for later larger experiments. It operated between 2016 and 2021.

Neutrinoless double-beta decay.

The Large Underground Xenon (LUX) experiment was a prototype for the search for dark matter. Dark matter particles are expected to interact very weakly with ordinary matter (sort of like neutrinos, but even less interactive). Such weakly interacting massive particles (WIMPs) might scatter off a nucleus in an atom of Xenon, shifting the nucleus enough that it emits electrons and light. These would be captured by detectors at the caps of the liquid Xenon container.

Once again, cosmic rays at the surface of the Earth would make the experiment unworkable, but deep underground there is much less background within which to look for the “needle in the haystack”. LUX operated from 2009 to 2016 and was not big enough to hope to see a WIMP, but like the Demonstrator, it was a proof-of-principle to show that the idea worked and could be expanded to a much larger 7-ton experiment called LUX-Zeplin that began in 2020 and is ongoing, looking for the biggest portion of mass in our universe. (About a quarter of the energy of the universe is composed of dark matter. The usual stuff we see around us only makes up about 4% of the energy of the universe.)

LUX-Zeplin Experiment

Deep Underground Neutrino Experiment (DUNE)

>>> “Always keep a sense of where you are,” Bill the geologist tells us, in case we must hike our way out.  But what sense is there?  I have a natural built-in compass that has served me well over the years, but it seems to run on the heavens.  When I visited South Africa, I had an eerie sense of disorientation the whole time I was there.  When you are a kilometer underground, the heavens are about as far away as Heaven.  There is no sense of orientation, only the sense of lefts and rights. 

We were told there would be signs directing us towards the Ross or Yates Shafts.  But once we are down here, it turns out that these “signs” are crudely spray-painted marks on the black rock, like bad graffiti.  When you see them, your first thought is of kids with spray cans making a mess—until you suddenly recognize an R or an O or two S’s along with an indistinct arrow that points slightly more one way than the other. <<<

Deep Underground Neutrino Experiment (DUNE).

One of the most ambitious high-energy experiments ever devised is the Long Baseline Neutrino Facility (LBNF) that is 800 miles long. It begins in Batavia, Illinois, at the Fermilab accelerator that launches a beam of neutrinos that travel 800 miles through the Earth to detectors at the Deep Underground Neutrino Experiment (DUNE) at SURF in Lead, South Dakota. The neutrinos are expected to oscillate in flavor, just like solar neutrinos, and the detection rates at DUNE could finally answer one of the biggest outstanding questions of physics: Why is our universe made of matter?

At the instant of the Big Bang, equal amounts of matter and antimatter should have been generated, and these should have annihilated in equal manner, and the universe should be filled with nothing but photons. But it’s not. Matter is everywhere. Why?

In the Standard Model there are many symmetries, also known as conserved properties. One power symmetry is known as CPT symmetry, where C is a symmetry of changing particles into the antiparticles, P is a reflection of left-handed or right-handed particles, and T is time-reversal symmetry. Yet there could be a CP symmetry too, which you might expect if time-reversal is taken as a symmetric property of physics. But it’s not!

There is a strange meson called a Kaon that does not decay the same way for its particle and antiparticle pair, violating CP symmetry. This was discovered in 1964 by James Cronin and Val Fitch who won the 1980 Nobel prize in physics. The discovery shocked the physics world. Since then, additional violations of CP symmetry have been observed in quarks. Such a broken symmetry is allowed in the Standard Model of particles, but the effect is so exceedingly smallCP is so extremely close to being a true symmetrythat it cannot explain the size of the matter-antimatter asymmetry in the universe.

Neutrino oscillations also can violate CP symmetry, but the effects have been hard to measurethus the need for DUNE. By creating large amounts of neutrinos, beaming them 800 miles through the Earth, and detecting them in the vast liquid Argon vats in the underground caverns of SURF, the parameters of neutrino oscillation can be measured directly, possibly explaining the matter asymmetry of the universeand answering Samwise’s question of why we are here.

Center for Understanding Subsurface Signals and Permeability (CUSSP)

>>> Finally, in the distance, as we rush down the dark drift, we see a bright glow that grows to envelope us with a string of white LED lights.  The drift is not so shabby here, with fresh pipes and electrical cables laid neatly by the side.  We had arrived at the CUSSP experimental site.  It turned out it was just a few steps away from the inactive Yates Shaft, that, if it had been operating, would have removed the need for the crazy train ride through black rock along broken tunnels.  But that is OK.  Because we are here, and this is what had brought us down into the Earth to answer questions down-to-Earth as we try to answer questions related to our future existence on this planet, learning what we need to generate the power for our high-tech society without making our planet unlivable.  <<<

Not all the science at SURF is so ethereal. For instance, research on Enhanced Geothermal Systems (EGS) is funded by the DOE Office of Basic Energy Sciences.  Geothermal systems can generate power by extracting super-heated water from underground to run turbines. However, superheated water is nasty stuff, very corrosive and full of minerals that tend to block up the fractures that the water flows through. The idea of enhanced geothermal systems is to drill boreholes and use “fracking” to create fractures in the hard rock, possibly refracturing older fractures that had become blocked. If this could be done reliably, then geothermal sites could be kept operating.

The Center for Understanding Subsurface Signals and Permeability (CUSSP) was recently funded by the DoE to use the facilities at SURF to study how well fracks can be controlled. The team is led by Pacific Northwest National Lab (PNNL) with collaborations from Lawrence Berkeley Lab, Maryland, Illinois and Purdue, among others. We are installing seismic equipment as well as electrical resistivity to monitor the induced fractures.

The CUSSP installation on the 4100 level was the destination of our underground journey, to see the boreholes in person and to get a sense of the fracture orientations at the drift wall. During the half hour at the site, rocks were examined, questions were answered, tall tales were told, and it was time to return.

Shooting to the Stars

>>> At the end of the tour, we pack again into the Ross cage and are thrust skyward at 2 meters per second—twice the speed as coming down because of the asymmetry of slack cables that could snag and snap.  Ears pop, and pop again, until the cage slows, and we settle to the exit level, relieved and tired and ready to see the sky. Thinking back, as we were shooting up the shaft, I imagined that the cage would never stop, flying up past the massive hoist, up and onward into the sky and to the stars.  <<<

In a video we had been shown about SURF, Jace DeCory, a scholar of the Lakota Sioux, spoke of the sacred ground of Ȟe Sápa—the Black Hills.  Are we taking again what is not ours?  This time it seems not.  The scientists of SURF are linking us to the stars, bringing knowledge instead of taking gold.  Jace quoted Carl Sagan: “We are made of star-stuff.”  Then she reminded us, the Lakota Sioux have known that all along.

Counting by the Waters of Babylon: The Secrets of the Babylonian 60-by-60 Multiplication System

Could you memorize a 60-by-60 multiplication table?  It has 1830 distinct numbers to memorize.

The answer today is an emphatic “No”!  Remember how long it took you to memorize the 12-by-12 table when you were a school child!

But 4000 years ago, the ancient Babylonians were doing it just fine—or at least “half” fine.  This is how.

How to Tally

In the ancient land of Sumer, the centralization of the economy, and the need of the government to control it, made it necessary to keep records of who owned what and who gave what to whom.  Scribes recorded transactions initially as tally marks pressed into soft clay around 5000 years ago, but one can only put so many marks on a clay tablet before it is full. 

Therefore, two inventions were needed to save space and time.  The first invention was a symbol that could stand in for a collection of tally marks.  Given the ten fingers we have on our hands, it is no surprise that this aggregate symbol stood for 10 units—almost every culture has some aspect of a base-10 number system.  With just two symbols repeated, numbers into the tens are easily depicted, as in Fig. 1. 

Figure 1.  Babylonian cuneiform numbers use agglutination and place notation

But by 4000 years ago, tallies were ranging into the millions, and a more efficient numerical notation was needed.  Hence, the second invention.

Place-value notation—an idea more abstract than the first—was so abstract that other cultures who drew from Mesopotamian mathematics, such as the Greeks and Romans, failed to recognize its power and adopt it. 

Today, we are so accustomed to place-value notation that it is hard to recognize how ingenious it is—how orders of magnitude are so easily encompassed in a few groups of symbols that keep track of thousands or millions at the same time as single units.  Our own decimal place-value system is from Hindu-Arabic numerals, which seems natural enough to us, but the mathematics of Old Babylon from the time of Hammurabi (1792 – 1750 BCE) was sexagesimal, based on the number 60. 

Our symbol for one hundred (100) using sexagesimal would be a pair of numbers (1,40) meaning 1×60+4×10. 

Our symbol for 119 would be (1, 59) meaning 1×60 + 5×10 + 9. 

Very large numbers are easily expressed.  Our symbol for 13,179,661 (using eight symbols) would be expressed in the sexagesimal system using only 5 symbols as (1, 1, 1, 1, 1) for 1×604 + 1×603 + 1×602 + 1×60 + 1. 

There has been much speculation on why a base 60 numeral system makes any sense.  The number does stand out because it has the largest number of divisors (1, 2, 3, 4, 5, 6, 10, 12, 15, 20, 30) of any smaller integer, and three of the divisors (2, 3, 5) are prime.  Babylonian mathematical manipulation relied heavily on fractions, and the availability of so many divisors may have been the chief advantage of the system.  The number the Babylonians used for the square root of 2 was (1; 24, 51, 10) = 1 + 24/60 + 51/602 + 10/603 = 1.41421296 which is accurate to almost seven decimal places.  It has been pointed out [1] that this sexagesimal approximation for root-2 is what would be obtained if the Newton-Raphson method were used to find the root of the equation x2-2=0 starting from an initial guess of 3/2 = 1.5. 

Squares, Products and Differences

One of the most important quantities in any civilization is the measurement of land areas.  Land ownership is a measure of wealth and power and until recent times it was a requirement for authority or even citizenship.  This remains true today when land possession and ownership are one the bricks in the foundation of social stability and status.  The size of a McMansion is a status symbol, and the number of acres is a statement of wealth and power.  Even renters are acutely aware of how many square feet they have in their apartment or house. 

In ancient Sumer and Babylon, the possession of land was critically important, and it was necessary to measure land areas to track the accumulation or loss of ownership.  Because the measurement of area requires the multiplication of numbers, it is no surprise that multiplication was one of the first mathematical developments.

Babylonian mathematics depended heavily on squares—literally square geometric figures—and the manipulation of squares formed their central algorithm for multiplication.

The algorithm begins by associating to any pair of number (a, b) a unique second pair (p’, q’) where p’ = (a+b)/2 is the semi-sum (known as the average), and q’ = (b-a)/2 is the semi-difference.  The Babylonian mathematicians discovered that the product of the first pair is given by the difference in the squares of the second pair

as depicted in Fig. 2. 

Figure 2.  Old Babylonian mathematics.  To a pair of numbers (a,b) is associated another pair (p’,q’): the average and the semi-difference.  The product of the first pair of numbers is equal to the difference in the squares of the second pair (ab = p’2 – q’2).  A specific example is shown on the right.

This simple relation between products, and the differences of squares, provides a significant savings in time and effort when constructing products of two large numbers—as long as the two numbers have the same parity.  That is the caveat!  The semi-sum and semi-difference each must be an integer, which only happens when the two numbers share the same parity (evenness or oddness).

Therefore, while a multiplication table up to 60 by 60 would have 60•61/4 = 915 distinct numbers to memorize, which could not be memorized easily, all squares up to 602 gives just 60 numbers to memorize, which is fewer than our children need to learn today. 

Therefore, with just 60 numbers, one could construct all 915 same-parity products of the 60 by 60 table using only sums and differences. 

Try it yourself.


[1] pg. 60, R. L. Cooke, The History of Mathematics: A Brief Course. (New York, John Wiley & Sons, 2012)

Read more in Books by David Nolte at Oxford University Press

Why Do Librarians Hate Books?

Beware! 

If you love books, don’t read this post.  Close the tab and look away from the second burning of the Library of Alexandria.

If you love books, then run to your favorite library (if it is still there), and take out every book you have ever thought of.  Fill your rooms and offices with checked-out books, the older the better, and never, ever, return them.  Keep clicking on RENEW, for as long as they let you.

The librarians had paved paradise and put up a parking lot. 

If you love books, the kind of rare valueless books on topics only you care about, then Librarians—the former Jedi gatekeepers of knowledge—have turned to the dark side, deaccessioning the unpopular books in the stacks, pulling their loan cards like tomb stones, shipping the books away in unmarked boxes like body bags to large warehouses to be sold for pennies—and you may never see them again.

The End of Physics

Just a few years ago my university, with little warning and no consultation with the physics faculty, closed the heart and soul of the Physics Department—our Physics Library.  It was a bright warm space where we met colleagues, quietly discussing deep theories, a place to escape for a minute or two, or for an hour, to browse a book picked from the shelf of new acquisitions—always something unexpected you would never think to search for online.  But that wasn’t the best part.

The best part was the three floors above, filled with dark and dusty stacks that seemed to rise higher than the building itself.  This was where you found the gems—books so old or so arcane that when you pulled them from the shelf to peer inside, they sent you back, like a time machine, to an era when physicists thought differently—not wrong, but differently.  And your understanding of your own physics was changed, seen with a longer lens, showing you things that went deeper than you expected, and you emerged from the stacks a changed person.

And then it was gone. 

They didn’t even need the space.  At a university where space is always in high demand, and turf wars erupt between departments who try to steal space in each other’s buildings, the dark cavernous rooms of the ex-physics library stood empty for years as the powers at be tried to figure out what to do with it.

This is the way a stack in a university library should look. It was too late to take a picture of a stack in my physics library, so this is from the Math library … the only topical library still left at my university among the dozen that existed only a few years ago.

So, I determined to try to understand how a room that stood empty would be more valuable to a university than a room full of books.  What I discovered was at the same time both mundane and shocking.  Mundane, because it delves into the rules and regulations that govern how universities function.  Shocking, because it is a betrayal of the very mission of universities and university libraries.

How to Get Accreditation Without Really Trying

Little strikes fear in the heart of a college administrator like the threat of losing accreditation.  Accreditation is the stamp of approval that drives sales—sales of slots in the freshman incoming class.  Without accreditation, a college is nothing more than a bunch of buildings housing over-educated educators.  But with accreditation, the college has a mandate to educate and has the moral authority to mold the minds of the next generation.

In times past—not too long past—let’s say up to the end of the last millennium, to receive accreditation, a college or university would need to spend something around 3% of its operating budget on the upkeep of its libraries.  For a moderate-sized university library system, this was on the order of $20M per year.  The requirement was a boon to the librarians who kept a constant lookout for new books to buy to populate the beloved “new acquisitions” shelf.

Librarians reveled in their leverage over the university administrators: buy books or lose accreditation.  It was a powerful negotiating position to be in.  But all that changed in the early 2000’s.  Universities are always strapped for cash (despite tuition increases rising at two-times the rate of inflation) and the librarian’s $20M cash cow was a tempting target.  Universities are also powerful, running their billion-dollar-a-year operations, and they lobbied the very organizations that give the accreditations, convincing them to remove the requirement for the minimum library budget.  After all, in the digital world, who needs expensive buildings filled with books, the vast majority of which never get checked out?

The Deaccessioning Wars: Double Fold

Twenty some years ago, a bibliovisionary by the name of Nicholson Baker recognized the book armegeddon of his age and wrote about it in Double Fold: Libraries and the Assault on Paper (Vintage Books/Random House, 2001).  Libraries everywhere were in the midst of an orgy of deaccessioning.  To deaccession a book means to remove it from the card catalog (an anachronism) and ship it off to second-hand book dealers.  But it was worse than that.  Many of the books, as well as rare journals and rarer newspapers, were being “guillotined” by cutting out each page and scanning it into some kind of visual/digital format before pitching all the pages into the recycle bin. The argument in favor of guillotining is that all paper must eventually decay to dust (a false assumption). 

The way to test whether a book, or a newspaper, is on its way to dissolution is to do the double fold test on a corner of a page.  You fold the corner over then back the other way—double fold—and repeat.  The double-fold number of a book is how many double folds it takes for the little triangular piece to fall off.  Any number less than a selected threshold gives a librarian carte blanch to deaccession the book, and maybe to guillotine it, regardless of how the book may be valued.

Librarians generally hate Baker’s little book Double Fold because deaccessioning is always a battle.  Given finite shelf space, for every new acquisition, something old needs to go.  How do you choose?  Any given item might be valued by someone, so an objective test that removes all shades of gray is the double-fold.  It is a blunt instrument, one that Nicholas Baker abhorred, but it does make room for the new—if that is all that a university library is for.

As an aside, as I write this blog, my university library, which does not own a copy of Double Fold, and through which I had to request a copy via Interlibrary Loan (ILL), is threatening me with punitive action if I don’t relinquish it because it is a few weeks overdue.  If my library had actually owned a copy, I could have taken it out and kept it on my office shelf for years, as long as I kept hitting that “renew” button on the library page.  (On the other hand, my university does own a book by the archivist Cox who wrote a poorly argued screed to try to refute Baker.)

The End of Deep Knowledge

Baker is already twenty years out of date, although his message is more dire now than ever.  In his day, deaccessioning was driven by that problem of finite shelf space—one book out for one book in.  Today, when virtually all new acquisitions are digital, that argument is moot.  Yet the current rate at which books are disappearing from libraries, and libraries themselves are disappearing from campuses, is nothing short of cataclysmic, dwarfing the little double-fold problem that Baker originally railed against.

My university used to have a dozen specialized libraries scattered across campus, with the Physics Library one of them.  Now there are maybe three in total.  One of those is the Main Library which was an imposing space filled with the broadest range of topics and a truly impressive depth of coverage.  You could stand in front of any stack and find beautifully produced volumes (with high-quality paper that would never fail the double fold test) on beautifully detailed topics, going as deep as you could wish to the very foundations of knowledge.

I am a writer of the history of science and technology, and as I write, I often will form a very specific question about how a new idea emerged.  What was its context?  How did it break free of old mindsets?  Why was it just one individual who saw the path forward?  What made them special?

My old practice was to look up a few books in the library catalog that may or may not have the kinds of answers I was looking for, then walk briskly across campus to the associated library (great for exercise and getting a break from my computer).  I would scan across the call numbers on the spines of the books until I found the book I sought—and then I would step back and look at the whole stack. 

Without fail, I would find gems I never knew existed, sometimes three, four or five shelves away from the book I first sought.  They were often on topics I never would have searched online.  And to find those gems, I would take down book after book, scanning them quickly before returning them to the shelf (yes, I know, re-shelving is a no-no, but the whole stack would be emptied if I followed the rules) and moving to the next—something you could never do online.  In ten minutes, or maybe half an hour if I lost track of time, I would have three or four books crucial to my argument in the crook of my arm, ready to walk down the stairs to circulation to take them out.  Often, the book that launched my search was not even among them.

A photo from the imperiled Math Library. The publication dates of the books on this short shelf range from the 1870’s to the 1970’s. A historian of mathematics could spend a year mining the stories that these books tell.

I thought that certainly this main library was safe, and I was looking forward to years ahead of me, even past retirement, buried in its stacks, sleuthing out the mysteries of the evolution of knowledge.

And then it was gone.

Not the building or the space—they were still there.  But the rows upon rows of stacks had been replaced with study space that students didn’t even need.  Once again, empty space was somehow more valuable to the library than having that space filled with books.  The librarians had paved paradise and put up a parking lot.  To me, it was like a death in the family. 

The Main Library after the recent remodel. This photo was taken at 11 am during the first week of the Fall semester 2024. This room used to be filled with full stacks of books. Now only about 10-20% of the books remain in the library. Notice the complete absence of students.

Why not bulldoze Williamsburg, Virginia, after digital capture? Why not burn the USS Constitution in Boston Bay after photographing it? Why not flatten the Alamo?

I recently looked up a book that was luckily still available at the Main Library in one of its few remaining stacks.  So I went to find it.  The shelves all around it were only about two-thirds filled, the wide gaps looking like abandoned store-fronts in a failing city.  And what books did remain were the superficial ones—the ones that any undergrad might want to take out to get an overview of some well-worn topic (which they could probably just get on Wikipedia).  All the deep knowledge (which Wikipedia will never see) was gone. 

I walked out with exactly the one book I had gone to find—not a single surprising gem to accompany it.  But the worst part is the opportunity cost: I will never know what I had failed to discover!

The stacks in 2024 are about 1/3 empty, and only about 20% of the stacks remain. The books that survived are the obvious ones.

Shrinking Budgets and Predatory Publishers

So why is a room that stands empty more valuable to a university than a room full of books? Here are the mundane and shocking answers.

On the one hand, library budgets are under assault. The following figure shows library expenditures as a percentage of total university expenditures averaged for 40 major university libraries tabulated by the ARL (Association of Research Libraries) from 1982 to 2017. There is an exponential decrease in the library budget as a function of year, with a break right around 2000-2001 when accreditation was no longer linked to library expenditures. Then the decay accelerated.

Combine decreasing rates of library funding with predatory publishers, and the problem is compounded. The following figure shows the increasing price of journal subscriptions that universities must pay relative to the normal inflation rate. The journal publishers are increasing their prices exponentially, tripling the cost each decade, a rate that erodes library budgets even more. Therefore, it is tempting to say that librarians don’t actually hate books, but are victims of bad economics. But that is the mundane answer.

The shocking answer is that modern librarians find books to be anachronistic. The new hires are by and large “digital librarians” who are focused on providing digital content to serve students who have become much more digital, especially after Covid. There is also a prevailing opinion among university librarians that students want more space to study, hence the removal of stacks to be replaced by soft chairs and open study spaces.

And that is the betrayal. The collections of deep knowledge, which are unique and priceless and irreplaceable, were replaced by generic study space that could be put anywhere at any time, having no intrinsic value.

You can argue that I still have access to the knowledge because of Interlibrary Loan (ILL). But ILL only works if other libraries have yet to remove the book. What happens when every library thinks that some other library has the book, and so they throw their own copy out? At some point that volume will have vanished from all collections and that will be the end of it.

Or you can argue that I can find the book digitally scanned on Internet Archive or Google Books. But I have already found situations where special folio pages, the very pages that I needed to make my argument, had failed to be reproduced in the digital versions. And the books were too rare to be allowed to go through ILL. So I was stuck.

(By the way, this was a rare copy of the works of Francois Arago. In my book Interference: Optical Interferometry and the Scientists who Tamed Light (Oxford University Press, 2023), I make the case that it was Arago who invented the first interferometer in 1816 long before Albert Michelson’s work in 1880. But for the final smoking gun, to prove my case, I needed that folio page which took Herculean efforts to eventually track down. Our Physics Library had the book in its stacks just a decade ago, and I could have just walked upstairs from my office to look at it. Where it is now is anyone’s guess.)

But digital scans are no substitute for the real thing. To hold an old volume in your hands, run off the printing press when the author was still alive, and filled with scribbled notes in the margins by your colleagues from years past, is to commune with history. Why not bulldoze Williamsburg, Virginia, after digital capture? Why not burn the USS Constitution in Boston Bay after photographing it? Why not flatten the Alamo? When you immerse yourself in these historical settings, you gain an understanding that is deeper than possible by browsing an article on Wikipedia.

People react to the real, like real books. Why take that away?

Acknowledgements: This post is the product of several discussions with my brother, James Nolte, a retired reference librarian. He was an early developer of digital libraries, working at Clarkson University in Potsdam, NY in the mid 1980’s. But like Frankenstein, he sometimes worries about the consequences of his own creation.

Where is IT Leading Us?

One of my favorite movies within the Star Wars movie franchise is Rogue One, the prequel to the very first movie (known originally simply as Star Wars but now called Episode IV: A New Hope). 

But I always thought there was a fundamental flaw in the plotline of Rogue One when the two main characters Jyn Erso and Cassian Andor (played by Felicity Jones and Diego Luna) are forced to climb a physical tower to retrieve a physical memory unit, like a hard drive, containing the plans to the Death Star. 

In such an advanced technological universe as Star Wars, why were the Death Star plans sitting on a single isolated hard drive, stored away like a file in a filing cabinet?  Why weren’t they encrypted and stored in bits and pieces across the cloud?  In fact, among all the technological wonders of the Star Wars universe, the cloud and the internet are conspicuously absent.  Why?

After the Microsoft IT crash of July 19, 2024, I think I know the answer: Because the internet and the cloud and computer operating systems are so fundamentally and hopelessly flawed that any advanced civilization would have dispensed with them eons ago.

Information Technology (IT)

I used to love buying a new computer.  It was a joy to boot up for the first time, like getting a new toy.  But those days may be over.

Now, when I buy a new computer through my university, the IT staff won’t deliver it until they have installed several layers of control systems overlayed on top of the OS.  And then all the problems start … incompatibilities, conflicts, permissions denied, failed software installation, failed VPN connections, unrecognized IP addresses, and on and on.

The problem, of course, is computer security.  There are so many IT hack attacks through so many different avenues that multiple layers of protection are needed to keep attackers out of the university network and off its computers.

But the security overhead is getting so burdensome, causing so many problems, that the dream from decades ago that the computer era would save all of us so much time has now become a nightmare as we spend hours per day just doing battle with IT issues.  More and more of our time is sucked into the IT black hole.

The Microsoft IT Crash of July 19, 2024

On Friday the 19th, we were in New York City, scheduled to fly out of Newark Airport around 2pm to return to Indianapolis. We knew we were in trouble when we looked at the news on Friday morning.  The top story was about an IT crash of Microsoft operating systems controlling airlines, banks and healthcare systems.

At Newark airport, we were greeted by the Blue Screen of Death (BSoD) on all the displays that should have been telling us about flight information.  Our United apps still worked on our iPhones, but our flight to Indy had been cancelled.  We took an option for a later flight and went to the United Club with two valid tickets and a lot of time to kill, but they wouldn’t let us in because their reader had crashed too. 

So we went to get pot stickers for lunch.  Our push notifications had been turned on, but we never received the alert that our second flight had been cancelled because the push notifications weren’t going out.  By the time we realized we had no flight, United had rebooked us on a flight 2 days later.

Not wanting to hang around the Newark airport for 2 days, we went online to rent a car to drive the 16 hours back to Indy, but all the cars were sold out.  In a last desperate act, we went onto Expedia and found an available car from Thrifty Car Rental—likely the very last one at the Newark airport.

So, on the road by 4pm we had 16 hours ahead of us before getting back home.  The cost out of pocket (even after subtracting the $400 refund from United on our return flight) was $700 … all because of one line of code in a Microsoft update.  The total estimated cost of that error worldwide is anticipated to exceed $1B. 

A House of Cards

The IT era began around 1980, about 45 years ago, when IBM launched its PC.  Operating systems were amazingly simplistic at that time, but slowly over the decades they grew into behemoths, add-ons adding to add-ons, cobbled together as if with chewing gum and baling wire.  Now they consist of millions of lines of code, patches on patches seeking to fix incompatibilities that create more incompatibilities in the process.

IT is a house of cards that takes only one bad line of code to bring the whole thing crashing down across the world.  This is particularly worrisome given the Axis of Chaos that resents seeing the free world enjoying its freedoms.  It’s an easy target.

But it doesn’t have to be this way.  It’s not unlike the early industrial revolution of steam power when every engine was different, or transportation when there were multiple railroad wheel widths, or electrification when AC did battle with DC, or telecommunications when different types of MUX on fiber-optic cables were incompatible.  This always happens when there is a revolution in technology that develops rapidly.

What is needed is a restart, to scrap the entire system and start from scratch.  Computer Scientists know how to build an efficient and resilient network from the ground up, with certification processes to remove the anonymity that enables cyber criminals to masquerade as legitimate operators.

But to do this requires a financial incentive.  The cost would be huge because the current system is so delocalized as every laptop or smart pad becomes a node in the network.  The Infrastructure Bill could still make this goal its target.  That would be revolutionary and enabling (like the Eisenhower Interstate System was in the 1950’s which transformed American society), instead of spending a trillion dollars to fill in potholes across a neglected infrastructure.

It may seem to be too late to start over, but a few more IT crashes like last Friday may make it mandatory.  Wouldn’t it be better to start now?

Albert Michelson and the American Century

Albert Michelson was the first American to win a Nobel Prize in science. He was awarded the Nobel Prize in physics in 1907 for the invention of his eponymous interferometer and for its development as a precision tool for metrology.  On board ship traveling to Sweden from London to receive his medal, he was insulted by the British author Rudyard Kipling (that year’s Nobel Laureate in literature) who quipped that America was filled with ignorant masses who wouldn’t amount to anything.

Notwithstanding Kipling’s prediction, across the following century, Americans were awarded 96 Nobel prizes in physics.  The next closest nationalities were Germany with 28, the United Kingdom with 25 and France with 18.  These are ratios of 3:1, 4:1 and 5:1.  Why was the United States so dominant, and why was Rudyard Kipling so wrong?

At the same time that American scientists were garnering the lion’s share of Nobel prizes in physics in the 20th century, the American real (inflation-adjusted) gross-domestic-product (GDP) grew from 60 billion dollars to 20 trillion dollars, making up about a third of the world-wide GDP, even though it has only about 5% of the world population.  So once again, why was the United States so dominant across the last century?  What factors contributed to this success?

The answers are complicated, with many contributing factors and lots of shades of gray.  But two factors stand out that grew hand-in-hand over the century; these are:

         1) The striking rise of American elite universities, and

         2) The significant gain in the US brain trust through immigration

Albert Michelson is a case in point.

The Firestorms of Albert Michelson

Albert Abraham Michelson was, to some, an undesirable immigrant, born poor in Poland to a Jewish family who made the arduous journey through the Panama Canal in the second wave of 49ers swarming over the California gold country.  Michelson grew up in the Wild West, first in the rough town of Murphy’s Camp in California, in foothills of the Sierras.  After his father’s supply store went up in flames, they moved to Virginia City, Nevada.  His younger brother Charlie lived by the gun (after Michelson had left home), providing meat and protection for supply trains during the Apache wars in the Southwest.  This was America in the raw.

Yet Michelson was a prodigy.  He outgrew the meager educational possibilities in the mining towns, so his family scraped together enough money to send him to a school in San Francisco, where he excelled.  Later, in Virginia City, an academic competition was held for a special appointment to the Naval Academy in Annapolis, and Michelson tied for first place, but the appointment went to the other student who was the son of a Civil War Vet. 

With the support of the local Jewish community, Michelson took a train to Washington DC (traveling on the newly-completed Transcontinental Railway, passing over the spot where a golden spike had been driven one month prior into a railroad tie made of Californian laurel) to make his case directly.  He met with President Grant at the White House, but all the slots at Annapolis had been filled.  Undaunted, Michelson camped out for three days in the waiting room of the office of an Annapolis Admiral, who finally relented and allowed Michelson to take the entrance exam.  Still, there was no place for him at the Academy.

Discouraged, Michelson bought a ticket and boarded the train for home.  One can only imagine his shock when he heard his name called out by a someone walking down the car aisle.  It was a courier from the White House.  Michelson met again with Grant, who made an extraordinary extra appointment for Michelson at Annapolis; the Admiral had made his case for him.  With no time to return home, he was on board ship for his first training cruise within a week, returning a month later to start classes.

Fig. 1 Albert Abraham Michelson

Years later, as Michelson prepared, with Edmund Morley, to perform the most sensitive test ever made of the motion of the Earth, using his recently-invented “Michelson Interferometer”, the building with his lab went up in flames, just like his father’s goods store had done years before.  This was a trying time for Michelson.  His first marriage was on the rocks, and he had just recovered from having a nervous breakdown (his wife at one point tried to have him committed to an insane asylum from where patients rarely ever returned).  Yet with Morley’s help, they completed the measurement. 

To Michelson’s dismay, the exquisite experiment with the finest sensitivity—that should have detected a large deviation of the fringes depending on the orientation of the interferometer relative to the motion of the Earth through space—gave a null result.  They published their findings, anyway, as one more puzzle in the question of the speed of light, little knowing how profound this “Michelson-Morley” experiment would be in the history of modern physics and the subsequent development of the relativity theory of Albert Einstein (another immigrant).

Putting the disappointing null result behind him, Michelson next turned his ultra-sensitive interferometer to the problem of replacing the platinum meter-bar standard in Paris with a new standard that was much more fundamental—wavelengths of light.  This work, unlike his null result, led to practical success for which he was awarded the Nobel Prize in 1907 (not for his null result with Morley).

Michelson’s Nobel Prize in physics in 1907 did not immediately open the floodgates.  Sixteen years passed before the next Nobel in physics went to an American (Robert Millikan).  But after 1936 (as many exiles from fascism in Europe immigrated to the US) Americans were regularly among the prize winners.

List of American Nobel Prizes in Physics

* (I) designates an immigrant.

  • 1907 Albert Michelson (I)     Optical precision instruments and metrology          
  • 1923 Robert Millikan             Elementary charge and photoelectric effect     
  • 1927 Arthur Compton          The Compton effect    
  • 1936 Carl David Anderson    Discovery of the positron
  • 1937 Clinton Davisson          Diffraction of electrons by crystals
  • 1939 Ernest Lawrence          Invention of the cyclotron     
  • 1943 Otto Stern (I)                Magnetic moment of the proton
  • 1944 Isidor Isaac Rabi (I)     Magnetic properties of atomic nuclei      
  • 1946 Percy Bridgman          High pressure physics
  • 1952 E. M. Purcell                 Nuclear magnetic precision measurements
  • 1952 Felix Bloch (I)              Nuclear magnetic precision measurements
  • 1955 Willis Lamb                   Fine structure of the hydrogen spectrum
  • 1955 Polykarp Kusch (I)       Magnetic moment of the electron
  • 1956 William Shockley (I)     Discovery of the transistor effect   
  • 1956 John Bardeen               Discovery of the transistor effect
  • 1956 Walter H. Brattain (I)   Discovery of the transistor effect   
  • 1957 Chen Ning Yang (I)     Parity laws of elementary particles
  • 1957 Tsung-Dao Lee (I)       Parity laws of elementary particles
  • 1959 Owen Chamberlain      Discovery of the antiproton
  • 1959 Emilio Segrè (I)            Discovery of the antiproton
  • 1960 Donald Glaser              Invention of the bubble chamber
  • 1961 Robert Hofstadter        The structure of nucleons
  • 1963 Maria Goeppert-Mayer (I)     Nuclear shell structure
  • 1963 Eugene Wigner (I)       Fundamental symmetry principles
  • 1964 Charles Townes          Quantum electronics   
  • 1965 Richard Feynman        Quantum electrodynamics   
  • 1965 Julian Schwinger          Quantum electrodynamics   
  • 1967 Hans Bethe (I)             Theory of nuclear reactions
  • 1968 Luis Alvarez                 Hydrogen bubble chamber
  • 1969 Murray Gell-Mann        Classification of elementary particles and interactions  
  • 1972 John Bardeen               Theory of superconductivity
  • 1972 Leon N. Cooper           Theory of superconductivity
  • 1972 Robert Schrieffer          Theory of superconductivity  
  • 1973 Ivar Giaever (I)            Tunneling phenomena
  • 1975 Ben Roy Mottelson      The structure of the atomic nucleus       
  • 1975 James Rainwater         The structure of the atomic nucleus       
  • 1976 Burton Richter              Discovery of a heavy elementary particle
  • 1976 Samuel C. C. Ting       Discovery of a heavy elementary particle         
  • 1977 Philip Anderson          Magnetic and disordered systems     
  • 1977 John van Vleck            Magnetic and disordered systems     
  • 1978 Robert Wilson       Discovery of cosmic microwave background radiation 
  • 1978 Arno Penzias (I)           Discovery of cosmic microwave background radiation
  • 1979 Steven Weinberg         Unified weak and electromagnetic interaction
  • 1979 Sheldon Glashow         Unified weak and electromagnetic interaction
  • 1980 James Cronin               Symmetry principles in the decay of neutral K-mesons
  • 1980 Val Fitch                       Symmetry principles in the decay of neutral K-mesons
  • 1981 Nicolaas Bloembergen (I)     Nonlinear Optics
  • 1981 Arthur Schawlow          Development of laser spectroscopy       
  • 1982 Kenneth Wilson          Theory for critical phenomena and phase transitions 
  • 1983 William Fowler             Formation of the chemical elements in the universe  
  • 1983 Subrahmanyan Chandrasekhar (I)         The evolution of the stars     
  • 1988 Leon Lederman          Discovery of the muon neutrino
  • 1988 Melvin Schwartz          Discovery of the muon neutrino
  • 1988 Jack Steinberger (I)     Discovery of the muon neutrino
  • 1989 Hans Dehmelt (I)         Ion trap     
  • 1989 Norman Ramsey          Atomic clocks     
  • 1990 Jerome Friedman         Deep inelastic scattering of electrons on nucleons
  • 1990 Henry Kendall              Deep inelastic scattering of electrons on nucleons
  • 1993 Russell Hulse               Discovery of a new type of pulsar 
  • 1993 Joseph Taylor Jr.         Discovery of a new type of pulsar 
  • 1994 Clifford Shull                Neutron diffraction      
  • 1995 Martin Perl                    Discovery of the tau lepton
  • 1995 Frederick Reines         Detection of the neutrino      
  • 1996 David Lee                    Discovery of superfluidity in helium-3
  • 1996 Douglas Osheroff       Discovery of superfluidity in helium-3     
  • 1996 Robert Richardson      Discovery of superfluidity in helium-3     
  • 1997 Steven Chu                  Laser atom traps
  • 1997 William Phillips             Laser atom traps
  • 1998 Horst Störmer (I)         Fractionally charged quantum Hall effect       
  • 1998 Robert Laughlin          Fractionally charged quantum Hall effect       
  • 1998 Daniel Tsui (I)              Fractionally charged quantum Hall effect
  • 2000 Jack Kilby                    Integrated circuit
  • 2001 Eric Cornell                  Bose-Einstein condensation
  • 2001 Carl Wieman                Bose-Einstein condensation
  • 2002 Raymond Davis Jr.      Cosmic neutrinos        
  • 2002 Riccardo Giacconi (I)   Cosmic X-ray sources 
  • 2003 Anthony Leggett (I)      The theory of superconductors and superfluids         
  • 2003 Alexei Abrikosov (I)     The theory of superconductors and superfluids         
  • 2004 David Gross                 Asymptotic freedom in the strong interaction
  • 2004 H. David Politzer          Asymptotic freedom in the strong interaction    
  • 2004 Frank Wilczek              Asymptotic freedom in the strong interaction
  • 2005 John Hall                      Quantum theory of optical coherence
  • 2005 Roy Glauber                 Quantum theory of optical coherence
  • 2006 John Mather                 Anisotropy of the cosmic background radiation
  • 2006 George Smoot             Anisotropy of the cosmic background radiation   
  • 2008 Yoichiro Nambu (I)      Spontaneous broken symmetry in subatomic physics
  • 2009 Willard Boyle (I)          CCD sensor       
  • 2009 George Smith              CCD sensor       
  • 2009 Charles Kao (I)            Fiber optics
  • 2011 Saul Perlmutter            Accelerating expansion of the Universe 
  • 2011 Brian Schmidt              Accelerating expansion of the Universe 
  • 2011 Adam Riess                  Accelerating expansion of the Universe
  • 2012 David Wineland          Atom Optics       
  • 2014 Shuji Nakamura (I)          Blue light-emitting diodes
  • 2016 F. Duncan Haldane (I)    Topological phase transitions        
  • 2016 John Kosterlitz (I)            Topological phase transitions        
  • 2017 Rainer Weiss (I)           LIGO detector and gravitational waves
  • 2017 Kip Thorne                   LIGO detector and gravitational waves
  • 2017 Barry Barish                 LIGO detector and gravitational waves
  • 2018 Arthur Ashkin               Optical tweezers
  • 2019 Jim Peebles (I)            Cosmology
  • 2020 Andrea Ghez                Milky Way black hole
  • 2021 Syukuro Manabe (I)     Global warming
  • 2022 John Clauser                Quantum entanglement

(Table information source.)

(Note:  This list does not include Enrico Fermi, who was awarded the Nobel Prize while in Italy.  After traveling to Stockholm to receive the award, he did not return to Italy, but went to the US to protect his Jewish wife from the new race laws enacted by the nationalist government of Italy.  There are many additional Nobel prize winners not on this list (like Albert Einstein) who received the Nobel Prize while in their own country but who then came to the US to teach at US institutions.)

Immigration and Elite Universities

A look at the data behind the previous list tells a striking story: 1) Nearly all of the American Nobel Prizes in physics were awarded for work performed at elite American universities; 2) Roughly a third of the prizes went to immigrants. And for those prize winners who were not immigrants themselves, many were taught by, or studied under, immigrant professors at those elite universities. 

Elite universities are not just the source of Nobel Prizes, but are engines of the economy. The Tech Sector may contribute only 10% of the US GDP, but 85% of our GDP is attributed to “innovation”, much of coming out of our universities.  Our “inventive” economy is driving the American standard of living and keeps us competitive in the worldwide market.

Today, elite universities, as well as immigration, are under attack by forces who want to make America great again.  Legislatures in some states have passed laws restricting how those universities hire and teach, and more states are following suite.  Some new state laws restrict where Chinese-born professors, who are teaching and conducting research at American universities, can or cannot buy houses.  And some members of Congress recently ambushed the leaders of a few of our most elite universities (who failed spectacularly to use common sense), using the excuse of a non-academic issue to turn universities into a metaphor for the supposed evils of elitism. 

But the forces seeking to make America great again may be undermining the very thing that made America great in the first place.

They want to cook the goose, but they are overlooking the golden eggs.