These timelines in the History of Dynamics are organized along the Chapters in Galileo Unbound (Oxford, 2018). The book is about the physics and history of dynamics including classical and quantum mechanics as well as general relativity and nonlinear dynamics (with a detour down evolutionary dynamics and game theory along the way). The first few chapters focus on Galileo, while the following chapters follow his legacy, as theories of motion became more abstract, eventually to encompass the evolution of species within the same theoretical framework as the orbit of photons around black holes.
Galileo: A New Scientist
Galileo Galilei was the first modern scientist, launching a new scientific method that superseded, after one and a half millennia, Aristotle’s physics. Galileo’s career began with his studies of motion at the University of Pisa that were interrupted by his move to the University of Padua and his telescopic discoveries of mountains on the moon and the moons of Jupiter. Galileo became the first rock star of science, and he used his fame to promote the ideas of Copernicus and the Sun-centered model of the solar system. But he pushed too far when he lampooned the Pope. Ironically, Galileo’s conviction for heresy and his sentence to house arrest for the remainder of his life gave him the free time to finally finish his work on the physics of motion, which he published in Two New Sciences in 1638.
1543 Copernicus dies, publishes posthumously De Revolutionibus
1564 Galileo born
1581 Enters University of Pisa
1585 Leaves Pisa without a degree
1586 Invents hydrostatic balance
1588 Receives lecturship in mathematics at Pisa
1592 Chair of mathematics at Univeristy of Padua
1595 Theory of the tides
1595 Invents military and geometric compass
1596 Le Meccaniche and the principle of horizontal inertia
1600 Bruno Giordano burned at the stake
1601 Death of Tycho Brahe
1609 Galileo constructs his first telescope, makes observations of the moon
1610 Galileo discovers 4 moons of Jupiter, Starry Messenger (Sidereus Nuncius), appointed chief philosopher and mathematician of the Duke of Tuscany, moves to Florence, observes Saturn, Venus goes through phases like the moon
1611 Galileo travels to Rome, inducted into the Lyncean Academy, name “telescope” is first used
1611 Scheiner discovers sunspots
1611 Galileo meets Barberini, a cardinal
1611 Johannes Kepler, Dioptrice
1613 Letters on sunspots published by Lincean Academy in Rome
1614 Galileo denounced from the pulpit
1615 (April) Bellarmine writes an essay against Coperinicus
1615 Galileo investigated by the Inquisition
1615 Writes Letter to Christina, but does not publish it
1615 (December) travels to Rome and stays at Tuscan embassy
1616 (January) Francesco Ingoli publishes essay against Copernicus
1616 (March) Decree against copernicanism
1616 Galileo publishes theory of tides, Galileo meets with Pope Paul V, Copernicus’ book is banned, Galileo warned not to support the Coperinican system, Galileo decides not to reply to Ingoli, Galileo proposes eclipses of Jupter’s moons to determine longitude at sea
1618 Three comets appear, Grassi gives a lecture not hostile to Galileo
1618 Galileo, through Mario Guiducci, publishes scathing attack on Grassi
1619 Jesuit Grassi (Sarsi) publishes attack on Galileo concerning 3 comets
1619 Marina Gamba dies, Galileo legitimizes his son Vinczenzio
1619 Kepler’s Laws, Epitome astronomiae Copernicanae.
1623 Barberini becomes Urban VIII, The Assayer published (response to Grassi)
1624 Galileo visits Rome and Urban VIII
1629 Birth of his grandson Galileo
1630 Death of Johanes Kepler
1632 Publication of the Dialogue Concerning the Two Chief World Systems, Galileo is indicted by the Inquisition (68 years old)
1633 (February) Travels to Rome
1633 Convicted, abjurs, house arrest in Rome, then Siena, then home to Arcetri
1638 Blind, publication of Two New Sciences
1642 Galileo dies (77 years old)
Galileo’s Trajectory
Galileo’s discovery of the law of fall and the parabolic trajectory began with early work on the physics of motion by predecessors like the Oxford Scholars, Tartaglia and the polymath Simon Stevin who dropped lead weights from the leaning tower of Delft three years before Galileo (may have) dropped lead weights from the leaning tower of Pisa. The story of how Galileo developed his ideas of motion is described in the context of his studies of balls rolling on inclined plane and the surprising accuracy he achieved without access to modern timekeeping.
1583 Galileo Notices isochronism of the pendulum
1588 Receives lecturship in mathematics at Pisa
1589 – 1592 Work on projectile motion in Pisa
1592 Chair of mathematics at Univeristy of Padua
1596 Le Meccaniche and the principle of horizontal inertia
1600 Guidobaldo shares technique of colored ball
1602 Proves isochronism of the pendulum (experimentally)
1604 First experiments on uniformly accelerated motion
1604 Wrote to Scarpi about the law of fall (s ≈ t2)
1607-1608 Identified trajectory as parabolic
1609 Velocity proportional to time
1632 Publication of the Dialogue Concerning the Two Chief World Systems, Galileo is indicted by the Inquisition (68 years old)
1636 Letter to Christina published in Augsburg in Latin and Italian
1638 Blind, publication of Two New Sciences
1641 Invented pendulum clock (in theory)
1642 Dies (77 years old)
On the Shoulders of Giants
Galileo’s parabolic trajectory launched a new approach to physics that was taken up by a new generation of scientists like Isaac Newton, Robert Hooke and Edmund Halley. The English Newtonian tradition was adopted by ambitious French iconoclasts who championed Newton over their own Descartes. Chief among these was Pierre Maupertuis, whose principle of least action was developed by Leonhard Euler and Joseph Lagrange into a rigorous new science of dynamics. Along the way, Maupertuis became embroiled in a famous dispute that entangled the King of Prussia as well as the volatile Voltaire who was mourning the death of his mistress Emilie du Chatelet, the lone female French physicist of the eighteenth century.
1644 Descartes’ vortex theory of gravitation
1662 Fermat’s principle
1669 – 1690 Huygens expands on Descartes’ vortex theory
1687 Newton’s Principia
1698 Maupertuis born
1729 Maupertuis entered University in Basel. Studied under Johann Bernoulli
1736 Euler publishes Mechanica sive motus scientia analytice exposita
1737 Maupertuis report on expedition to Lapland. Earth is oblate. Attacks Cassini.
1744 Maupertuis Principle of Least Action. Euler Principle of Least Action.
1745 Maupertuis becomes president of Berlin Academy. Paris Academy cancels his membership after a campaign against him by Cassini.
1746 Maupertuis principle of Least Action for mass
1751 Samuel König disputes Maupertuis’ priority
1756 Cassini dies. Maupertuis reinstated in the French Academy
1759 Maupertuis dies
1759 du Chatelet’s French translation of Newton’s Principia published posthumously
1760 Euler 3-body problem (two fixed centers and coplanar third body)
1760-1761 Lagrange, Variational calculus (J. L. Lagrange, “Essai d’une nouvelle méthod pour dEeterminer les maxima et lest minima des formules intégrales indéfinies,” Miscellanea Teurinensia, (1760-1761))
1762 Beginning of the reign of Catherine the Great of Russia
1763 Euler colinear 3-body problem
1765 Euler publishes Theoria motus corporum solidorum on rotational mechanics
1766 Euler returns to St. Petersburg
1766 Lagrange arrives in Berlin
1772 Lagrange equilateral 3-body problem, Essai sur le problème des trois corps, 1772, Oeuvres tome 6
1775 Beginning of the American War of Independence
1776 Adam Smith Wealth of Nations
1781 William Herschel discovers Uranus
1783 Euler dies in St. Petersburg
1787 United States Constitution written
1787 Lagrange moves from Berlin to Paris
1788 Lagrange, Méchanique analytique
1789 Beginning of the French Revolution
1799 Pierre-Simon Laplace Mécanique Céleste (1799-1825)
Geometry on My Mind
This history of modern geometry focuses on the topics that provided the foundation for the new visualization of physics. It begins with Carl Gauss and Bernhard Riemann, who redefined geometry and identified the importance of curvature for physics. Vector spaces, developed by Hermann Grassmann, Giuseppe Peano and David Hilbert, are examples of the kinds of abstract new spaces that are so important for modern physics, such as Hilbert space for quantum mechanics. Fractal geometry developed by Felix Hausdorff later provided the geometric language needed to solve problems in chaos theory.
1629 Fermat described higher-dim loci
1637 Descarte’s Geometry
1649 van Schooten’s commentary on Descartes Geometry
1694 Leibniz uses word “coordinate” in its modern usage
1697 Johann Bernoulli shortest distance between two points on convex surface
1732 Euler geodesic equations for implicit surfaces
1748 Euler defines modern usage of function
1801 Gauss calculates orbit of Ceres
1807 Fourier analysis (published in 1822(
1807 Gauss arrives in Göttingen
1827 Karl Gauss establishes differential geometry of curved surfaces, Disquisitiones generales circa superficies curvas
1830 Bolyai and Lobachevsky publish on hyperbolic geometry
1834 Jacobi n-fold integrals and volumes of n-dim spheres
1836 Liouville-Sturm theorem
1838 Liouville’s theorem
1841 Jacobi determinants
1843 Arthur Cayley systems of n-variables
1843 Hamilton discovers quaternions
1844 Hermann Grassman n-dim vector spaces, Die Lineale Ausdehnungslehr
1846 Julius Plücker System der Geometrie des Raumes in neuer analytischer Behandlungsweise
1848 Jacobi Vorlesungen über Dynamik
1848 “Vector” coined by Hamilton
1854 Riemann’s habilitation lecture
1861 Riemann n-dim solution of heat conduction
1868 Publication of Riemann’s Habilitation
1869 Christoffel and Lipschitz work on multiple dimensional analysis
1871 Betti refers to the n-ply of numbers as a “space”.
1871 Klein publishes on non-euclidean geometry
1872 Boltzmann distribution
1872 Jordan Essay on the geometry of n-dimensions
1872 Felix Klein’s “Erlangen Programme”
1872 Weierstrass’ Monster
1872 Dedekind cut
1872 Cantor paper on irrational numbers
1872 Cantor meets Dedekind
1872 Lipschitz derives mechanical motion as a geodesic on a manifold
1874 Cantor beginning of set theory
1877 Cantor one-to-one correspondence between the line and n-dimensional space
1881 Gibbs codifies vector analysis
1883 Cantor set and staircase Grundlagen einer allgemeinen Mannigfaltigkeitslehre
1884 Abbott publishes Flatland
1887 Peano vector methods in differential geometry
1890 Peano space filling curve
1891 Hilbert space filling curve
1887 Darboux vol. 2 treats dynamics as a point in d-dimensional space. Applies concepts of geodesics for trajectories.
1898 Ricci-Curbastro Lesons on the Theory of Surfaces
1902 Lebesgue integral
1904 Hilbert studies integral equations
1904 von Koch snowflake
1906 Frechet thesis on square summable sequences as infinite dimensional space
1908 Schmidt Geometry in a Function Space
1910 Brouwer proof of dimensional invariance
1913 Hilbert space named by Riesz
1914 Hilbert space used by Hausdorff
1915 Sierpinski fractal triangle
1918 Hausdorff non-integer dimensions
1918 Weyl’s book Space, Time, Matter
1918 Fatou and Julia fractals
1920 Banach space
1927 von Neumann axiomatic form of Hilbert Space
1935 Frechet full form of Hilbert Space
1967 Mandelbrot coast of Britain
1982 Mandelbrot’s book The Fractal Geometry of Nature
The Tangled Tale of Phase Space
Phase space is the central visualization tool used today to study complex systems. The chapter describes the origins of phase space with the work of Joseph Liouville and Carl Jacobi that was later refined by Ludwig Boltzmann and Rudolf Clausius in their attempts to define and explain the subtle concept of entropy. The turning point in the history of phase space was when Henri Poincaré used phase space to solve the three-body problem, uncovering chaotic behavior in his quest to answer questions on the stability of the solar system. Phase space was established as the central paradigm of statistical mechanics by JW Gibbs and Paul Ehrenfest.
1804 Jacobi born (1904 – 1851) in Potsdam
1804 Napoleon I Emperor of France
1806 William Rowan Hamilton born (1805 – 1865)
1807 Thomas Young describes “Energy” in his Course on Natural Philosophy (Vol. 1 and Vol. 2)
1808 Bethoven performs his Fifth Symphony
1809 Joseph Liouville born (1809 – 1882)
1821 Hermann Ludwig Ferdinand von Helmholtz born (1821 – 1894)
1824 Carnot published Reflections on the Motive Power of Fire
1834 Jacobi n-fold integrals and volumes of n-dim spheres
1834-1835 Hamilton publishes his principle (1834, 1835).
1836 Liouville-Sturm theorem
1837 Queen Victoria begins her reign as Queen of England
1838 Liouville develops his theorem on products of n differentials satisfying certain first-order differential equations. This becomes the classic reference to Liouville’s Theorem.
1847 Helmholtz Conservation of Energy (force)
1849 Thomson makes first use of “Energy” (From reading Thomas Young’s lecture notes)
1850 Clausius establishes First law of Thermodynamics: Internal energy. Second law: Heat cannot flow unaided from cold to hot. Not explicitly stated as first and second laws
1851 Thomson names Clausius’ First and Second laws of Thermodynamics
1852 Thomson describes general dissipation of the universe (“energy” used in title)
1854 Thomson defined absolute temperature. First mathematical statement of 2nd law. Restricted to reversible processes
1854 Clausius stated Second Law of Thermodynamics as inequality
1857 Clausius constructs kinetic theory, Mean molecular speeds
1858 Clausius defines mean free path, Molecules have finite size. Clausius assumed that all molecules had the same speed
1860 Maxwell publishes first paper on kinetic theory. Distribution of speeds. Derivation of gas transport properties
1865 Loschmidt size of molecules
1865 Clausius names entropy
1868 Boltzmann adds (Boltzmann) factor to Maxwell distribution
1872 Boltzmann transport equation and H-theorem
1876 Loschmidt reversibility paradox
1877 Boltzmann S = k logW
1890 Poincare: Recurrence Theorem. Recurrence paradox with Second Law (1893)
1896 Zermelo criticizes Boltzmann
1896 Boltzmann posits direction of time to save his H-theorem
1898 Boltzmann Vorlesungen über Gas Theorie
1905 Boltzmann kinetic theory of matter in Encyklopädie der mathematischen Wissenschaften
1906 Boltzmann dies
1910 Paul Hertz uses “Phase Space” (Phasenraum)
1911 Ehrenfest’s article in Encyklopädie der mathematischen Wissenschaften
1913 A. Rosenthal writes the first paper using the phrase “phasenraum”, combining the work of Boltzmann and Poincaré. “Beweis der Unmöglichkeit ergodischer Gassysteme” (Ann. D. Physik, 42, 796 (1913)
1913 Plancheral, “Beweis der Unmöglichkeit ergodischer mechanischer Systeme” (Ann. D. Physik, 42, 1061 (1913). Also uses “Phasenraum”.
The Lens of Gravity
Gravity provided the backdrop for one of the most important paradigm shifts in the history of physics. Prior to Albert Einstein’s general theory of relativity, trajectories were paths described by geometry. After the theory of general relativity, trajectories are paths caused by geometry. This chapter explains how Einstein arrived at his theory of gravity, relying on the space-time geometry of Hermann Minkowski, whose work he had originally harshly criticized. The confirmation of Einstein’s theory was one of the dramatic high points in 20th century history of physics when Arthur Eddington journeyed to an island off the coast of Africa to observe stellar deflections during a solar eclipse. If Galileo was the first rock star of physics, then Einstein was the first worldwide rock star of science.
1697 Johann Bernoulli was first to find solution to shortest path between two points on a curved surface (1697).
1728 Euler found the geodesic equation.
1783 The pair 40 Eridani B/C was discovered by William Herschel on 31 January
1783 John Michell explains infalling object would travel faster than speed of light
1796 Laplace describes “dark stars” in Exposition du system du Monde
1827 The first orbit of a binary star computed by Félix Savary for the orbit of Xi Ursae Majoris.
1827 Gauss curvature Theoriem Egregum
1844 Bessel notices periodic displacement of Sirius with period of half a century
1844 The name “geodesic line” is attributed to Liouville.
1845 Buys Ballot used musicians with absolute pitch for the first experimental verification of the Doppler effect
1854 Riemann’s habilitationsschrift
1862 Discovery of Sirius B (a white dwarf)
1868 Darboux suggested motions in n-dimensions
1872 Lipshitz first to apply Riemannian geometry to the principle of least action.
1895 Hilbert arrives in Göttingen
1902 Minkowski arrives in Göttingen
1905 Einstein’s miracle year
1906 Poincaré describes Lorentz transformations as rotations in 4D
1907 Einstein has “happiest thought” in November
1907 Einstein’s relativity review in Jahrbuch
1908 Minkowski’s Space and Time lecture
1908 Einstein appointed to unpaid position at University of Bern
1909 Minkowski dies
1909 Einstein appointed associate professor of theoretical physics at U of Zürich
1910 40 Eridani B was discobered to be of spectral type A (white dwarf)
1910 Size and mass of Sirius B determined (heavy and small)
1911 Laue publishes first textbook on relativity theory
1911 Einstein accepts position at Prague
1911 Einstein goes to the limits of special relativity applied to gravitational fields
1912 Einstein’s two papers establish a scalar field theory of gravitation
1912 Einstein moves from Prague to ETH in Zürich in fall. Begins collaboration with Grossmann.
1913 Einstein EG paper
1914 Adams publishes spectrum of 40 Eridani B
1915 Sirius B determined to be also a low-luminosity type A white dwarf
1915 Einstein Completes paper
1916 Density of 40 Eridani B by Ernst Öpik
1916 Schwarzschild paper
1916 Einstein’s publishes theory of gravitational waves
1919 Eddington expedition to Principe
1920 Eddington paper on deflection of light by the sun
1922 Willem Luyten coins phrase “white dwarf”
1924 Eddington found a set of coordinates that eliminated the singularity at the Schwarzschild radius
1926 R. H. Fowler publishes paper on degenerate matter and composition of white dwarfs
1931 Chandrasekhar calculated the limit for collapse to white dwarf stars at 1.4MS
1933 Georges Lemaitre states the coordinate singularity was an artefact
1934 Walter Baade and Fritz Zwicky proposed the existence of the neutron star only a year after the discovery of the neutron by Sir James Chadwick.
1939 Oppenheimer and Snyder showed ultimate collapse of a 3MS “frozen star”
1958 David Finkelstein paper
1965 Antony Hewish and Samuel Okoye discovered “an unusual source of high radio brightness temperature in the Crab Nebula”. This source turned out to be the Crab Nebula neutron star that resulted from the great supernova of 1054.
1967 Jocelyn Bell and Antony Hewish discovered regular radio pulses from CP 1919. This pulsar was later interpreted as an isolated, rotating neutron star.
1967 Wheeler’s “black hole” talk
1974 Joseph Taylor and Russell Hulse discovered the first binary pulsar, PSR B1913+16, which consists of two neutron stars (one seen as a pulsar) orbiting around their center of mass.
2015 LIGO detects gravitational waves on Sept. 14 from the merger of two black holes
2017 LIGO detects the merger of two neutron stars
On the Quantum Footpath
The concept of the trajectory of a quantum particle almost vanished in the battle between Werner Heisenberg’s matrix mechanics and Erwin Schrödinger’s wave mechanics. It took Niels Bohr and his complementarity principle of wave-particle duality to cede back some reality to quantum trajectories. However, Schrödinger and Einstein were not convinced and conceived of quantum entanglement to refute the growing acceptance of the Copenhagen Interpretation of quantum physics. Schrödinger’s cat was meant to be an absurdity, but ironically it has become a central paradigm of practical quantum computers. Quantum trajectories took on new meaning when Richard Feynman constructed quantum theory based on the principle of least action, inventing his famous Feynman Diagrams to help explain quantum electrodynamics.
1885 Balmer Theory
1897 J. J. Thomson discovered the electron
1904 Thomson plum pudding model of the atom
1911 Bohr PhD thesis filed. Studies on the electron theory of metals. Visited England.
1911 Rutherford nuclear model
1911 First Solvay conference
1911 “ultraviolet catastrophe” coined by Ehrenfest
1913 Bohr combined Rutherford’s nuclear atom with Planck’s quantum hypothesis: 1913 Bohr model
1913 Ehrenfest adiabatic hypothesis
1914-1916 Bohr at Manchester with Rutherford
1916 Bohr appointed Chair of Theoretical Physics at University of Copenhagen: a position that was made just for him
1916 Schwarzschild and Epstein introduce action-angle coordinates into quantum theory
1920 Heisenberg enters University of Munich to obtain his doctorate
1920 Bohr’s Correspondence principle: Classical physics for large quantum numbers
1921 Bohr Founded Institute of Theoretical Physics (Copenhagen)
1922-1923 Heisenberg studies with Born, Franck and Hilbert at Göttingen while Sommerfeld is in the US on sabbatical.
1923 Heisenberg Doctorate. The exam does not go well. Unable to derive the resolving power of a microscope in response to question by Wien. Becomes Born’s assistant at Göttingen.
1924 Heisenberg visits Niels Bohr in Copenhagen (and met Einstein?)
1924 Heisenberg Habilitation at Göttingen on anomalous Zeeman
1924 – 1925 Heisenberg worked with Bohr in Copenhagen, returned summer of 1925 to Göttiingen
1924 Pauli exclusion principle and state occupancy
1924 de Broglie hypothesis extended wave-particle duality to matter
1924 Bohr Predicted Halfnium (72)
1924 Kronig’s proposal for electron self spin
1924 Bose (Einstein)
1925 Heisenberg paper on quantum mechanics
1925 Dirac, reading proof from Heisenberg, recognized the analogy of noncommutativity with Poisson brackets and the correspondence with Hamiltonian mechanics.
1925 Uhlenbeck and Goudschmidt: spin
1926 Born, Heisenberg, Kramers: virtual oscillators at transition frequencies: Matrix mechanics (alternative to Bohr-Kramers-Slater 1924 model of orbits). Heisenberg was Born’s student at Göttingen.
1926 Schrödinger wave mechanics
1927 de Broglie hypotehsis confirmed by Davisson and Germer
1927 Complementarity by Bohr: wave-particle duality “Evidence obtained under different experimental conditions cannot be comprehended within a single picture, but must be regarded as complementary in the sense that only the totality of the phenomena exhausts the possible information about the objects.”
1927 Heisenberg uncertainty principle (Heisenberg was in Copenhagen 1926 – 1927)
1927 Solvay Conference in Brussels
1928 Heisenberg to University of Leipzig
1928 Dirac relativistic QM equation
1929 de Broglie Nobel Prize
1930 Solvay Conference
1932 Heisenberg Nobel Prize
1932 von Neumann operator algebra
1933 Dirac Lagrangian form of QM (basis of Feynman path integral)
1933 Schrödinger and Dirac Nobel Prize
1935 Einstein, Poldolsky and Rosen EPR paper
1935 Bohr’s response to Einsteins “EPR” paradox
1935 Schrodinger’s cat
1939 Feynman graduates from MIT
1941 Heisenberg (head of German atomic project) visits Bohr in Copenhagen
1942 Feynman PhD at Princeton, “The Principle of Least Action in Quantum Mechanics“
1942 – 1945 Manhattan Project, Bethe-Feynman equation for fission yield
1943 Bohr escapes to Sweden in a fishing boat. Went on to England secretly.
1945 Pauli Nobel Prize
1945 Death of Feynman’s wife Arline (married 4 years)
1945 Fall, Feynman arrives at Cornell ahead of Hans Bethe
1947 Shelter Island conference: Lamb Shift, did Kramer’s give a talk suggesting that infinities could be subtracted?
1947 Fall, Dyson arrives at Cornell
1948 Pocono Manor, Pennsylvania, troubled unveiling of path integral formulation and Feynman diagrams, Schwinger’s master presentation
1948 Feynman and Dirac. Summer drive across the US with Dyson
1949 Dyson joins IAS as a postdoc, trains a cohort of theorists in Feynman’s technique
1949 Karplus and Kroll first g-factor calculation
1950 Feynman moves to Cal Tech
1965 Schwinger, Tomonaga and Feynman Nobel Prize
1967 Hans Bethe Nobel Prize
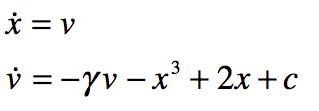
From Butterflies to Hurricanes
Half a century after Poincaré first glimpsed chaos in the three-body problem, the great Russian mathematician Andrey Kolmogorov presented a sketch of a theorem that could prove that orbits are stable. In the hands of Vladimir Arnold and Jürgen Moser, this became the KAM theory of Hamiltonian chaos. This chapter shows how KAM theory fed into topology in the hands of Stephen Smale and helped launch the new field of chaos theory. Edward Lorenz discovered chaos in numerical models of atmospheric weather and discovered the eponymous strange attractor. Mathematical aspects of chaos were further developed by Mitchell Feigenbaum studying bifurcations in the logistic map that describes population dynamics.
1760 Euler 3-body problem (two fixed centers and coplanar third body)
1763 Euler colinear 3-body problem
1772 Lagrange equilateral 3-body problem
1881-1886 Poincare memoires “Sur les courbes de ́finies par une equation differentielle”
1890 Poincare “Sur le probleme des trois corps et les equations de la dynamique”. First-return map, Poincare recurrence theorem, stable and unstable manifolds
1892 – 1899 Poincare New Methods in Celestial Mechanics
1892 Lyapunov The General Problem of the Stability of Motion
1899 Poincare homoclinic trajectory
1913 Birkhoff proves Poincaré’s last geometric theorem, a special case of the three-body problem.
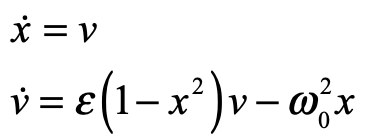
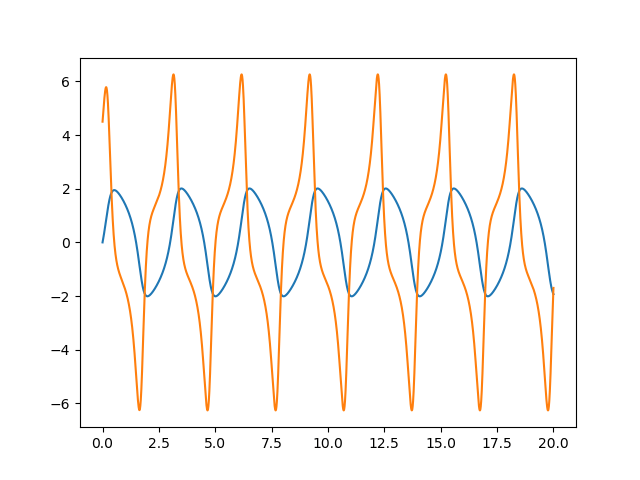
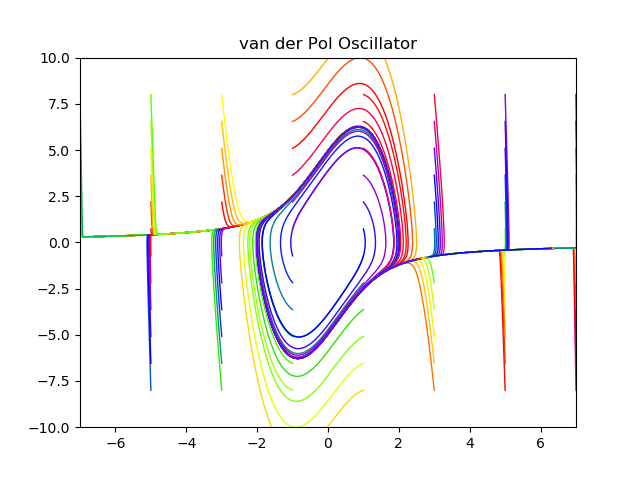
1927 van der Pol and van der Mark
1937 Coarse systems, Andronov and Pontryagin
1938 Morse theory
1942 Hopf bifurcation
1945 Cartwright and Littlewood study the van der Pol equation (Radar during WWII)
1954 Kolmogorov A. N., On conservation of conditionally periodic motions for a small change in Hamilton’s function.
1960 Lorenz: 12 equations
1962 Moser On Invariant Curves of Area-Preserving Mappings of an Annulus.
1963 Arnold Small denominators and problems of the stability of motion in classical and celestial mechanics
1963 Lorenz: 3 equations
1964 Arnold diffusion
1965 Smale’s horseshoe
1969 Chirikov standard map
1971 Ruelle-Takens (Ruelle coins phrase “strange attractor”)
1972 “Butterfly Effect” given for Lorenz’ talk (by Philip Merilees)
1975 Gollub-Swinney observe route to turbulence along lines of Ruelle
1975 Yorke coins “chaos theory”
1976 Robert May writes review article of the logistic map
1977 New York conference on bifurcation theory
1987 James Gleick Chaos: Making a New Science
Darwin in the Clockworks
The preceding timelines related to the central role played by families of trajectories phase space to explain the time evolution of complex systems. These ideas are extended to explore the history and development of the theory of natural evolution by Charles Darwin. Darwin had many influences, including ideas from Thomas Malthus in the context of economic dynamics. After Darwin, the ideas of evolution matured to encompass broad topics in evolutionary dynamics and the emergence of the idea of fitness landscapes and game theory driving the origin of new species. The rise of genetics with Gregor Mendel supplied a firm foundation for molecular evolution, leading to the moleculer clock of Linus Pauling and the replicator dynamics of Richard Dawkins.
1202 Fibonacci
1766 Thomas Robert Malthus born
1776 Adam Smith The Wealth of Nations
1798 Malthus “An Essay on the Principle of Population”
1817 Ricardo Principles of Political Economy and Taxation
1838 Cournot early equilibrium theory in duopoly
1848 John Stuart Mill
1848 Karl Marx Communist Manifesto
1859 Darwin Origin of Species
1867 Karl Marx Das Kapital
1871 Darwin Descent of Man, and Selection in Relation to Sex
1871 Jevons Theory of Political Economy
1871 Menger Principles of Economics
1874 Walrus Éléments d’économie politique pure, or Elements of Pure Economics (1954)
1890 Marshall Principles of Economics
1908 Hardy constant genetic variance
1910 Brouwer fixed point theorem
1910 Alfred J. Lotka autocatylitic chemical reactions
1913 Zermelo determinancy in chess
1922 Fisher dominance ratio
1922 Fisher mutations
1925 Lotka predator-prey in biomathematics
1926 Vita Volterra published same equations independently
1927 JBS Haldane (1892—1964) mutations
1928 von Neumann proves the minimax theorem
1930 Fisher ratio of sexes
1932 Wright Adaptive Landscape
1932 Haldane The Causes of Evolution
1933 Kolmogorov Foundations of the Theory of Probability
1934 Rudolph Carnap The Logical Syntax of Language
1936 John Maynard Keynes, The General Theory of Employment, Interest and Money
1936 Kolmogorov generalized predator-prey systems
1938 Borel symmetric payoff matrix
1942 Sewall Wright Statistical Genetics and Evolution
1943 McCulloch and Pitts A Logical Calculus of Ideas Immanent in Nervous Activity
1944 von Neumann and Morgenstern Theory of Games and Economic Behavior
1950 Prisoner’s Dilemma simulated at Rand Corportation
1950 John Nash Equilibrium points in n-person games and The Bargaining Problem
1951 John Nash Non-cooperative Games
1952 McKinsey Introduction to the Theory of Games (first textbook)
1953 John Nash Two-Person Cooperative Games
1953 Watson and Crick DNA
1955 Braithwaite’s Theory of Games as a Tool for the Moral Philosopher
1961 Lewontin Evolution and the Theory of Games
1962 Patrick Moran The Statistical Processes of Evolutionary Theory
1962 Linus Pauling molecular clock
1968 Motoo Kimura neutral theory of molecular evolution
1972 Maynard Smith introduces the evolutionary stable solution (ESS)
1972 Gould and Eldridge Punctuated equilibrium
1973 Maynard Smith and Price The Logic of Animal Conflict
1973 Black Scholes
1977 Eigen and Schuster The Hypercycle
1978 Replicator equation (Taylor and Jonker)
1982 Hopfield network
1982 John Maynard Smith Evolution and the Theory of Games
1984 R. Axelrod The Evolution of Cooperation
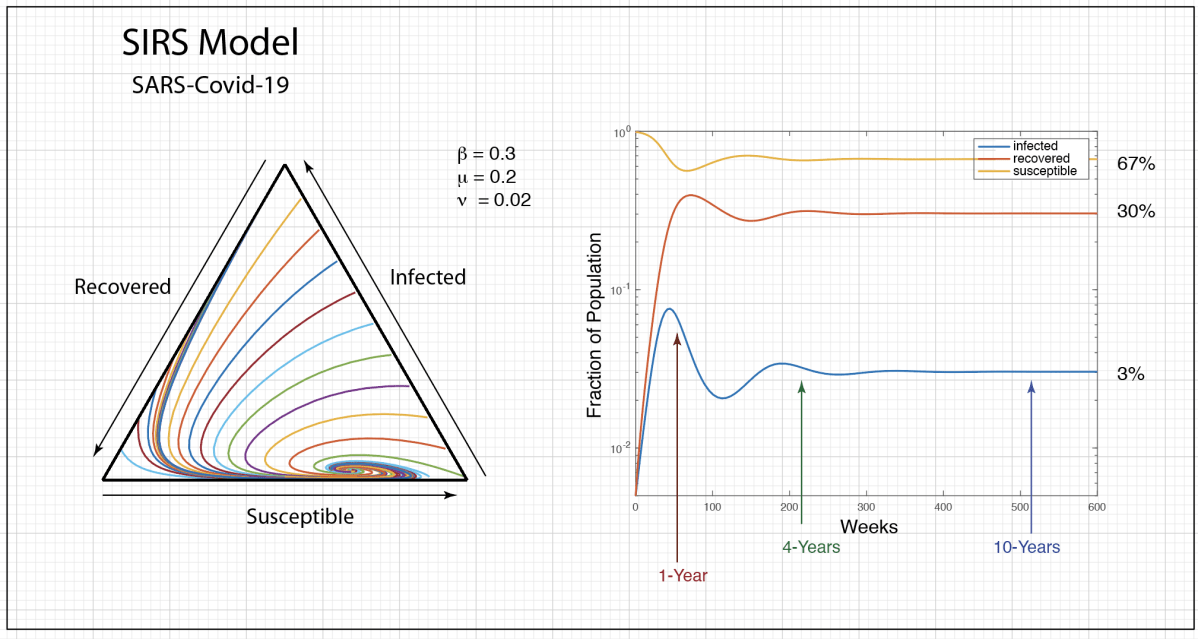
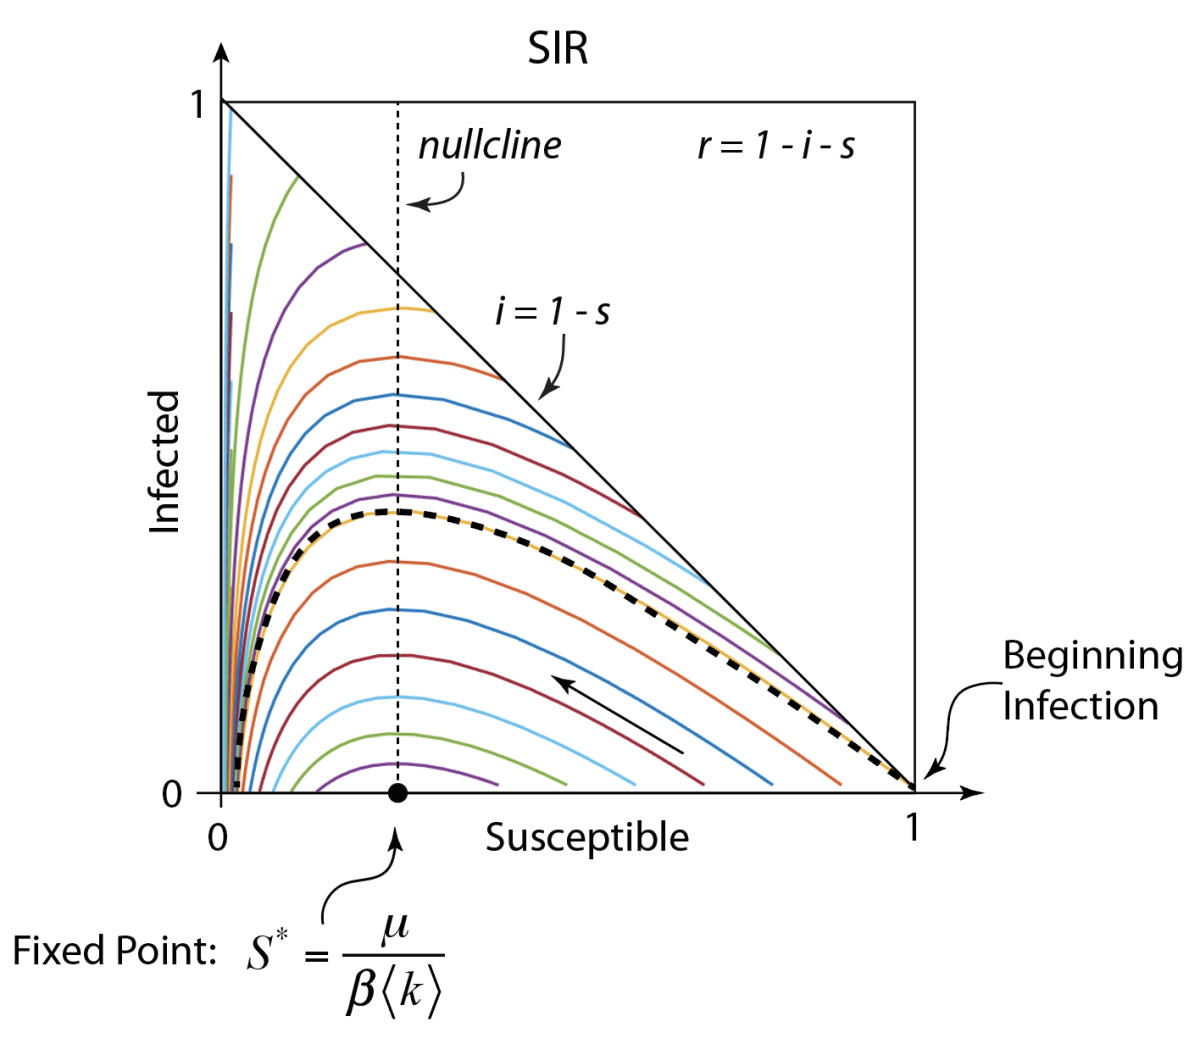
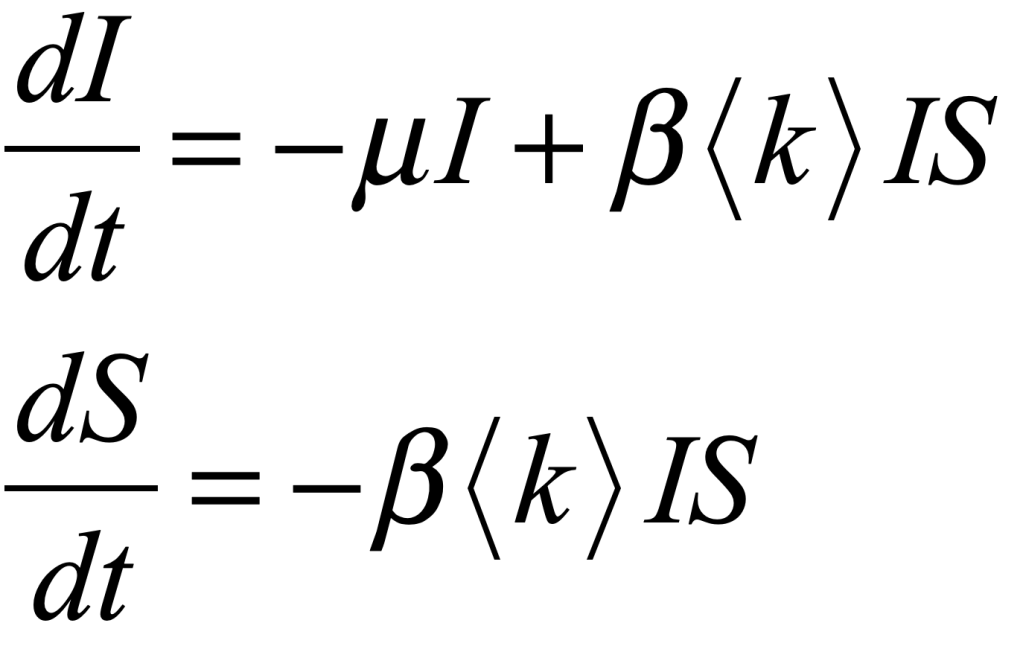
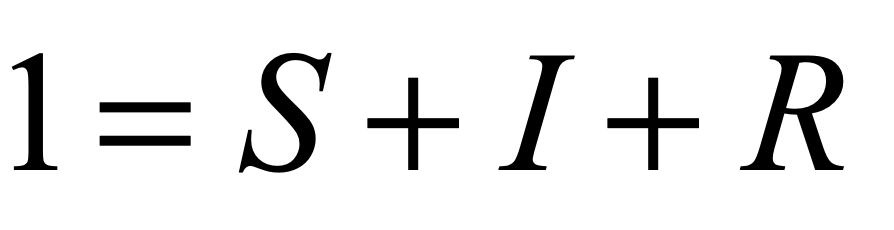
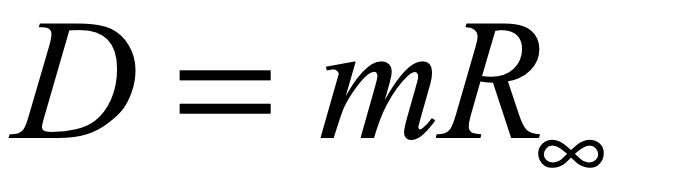
The Measure of Life
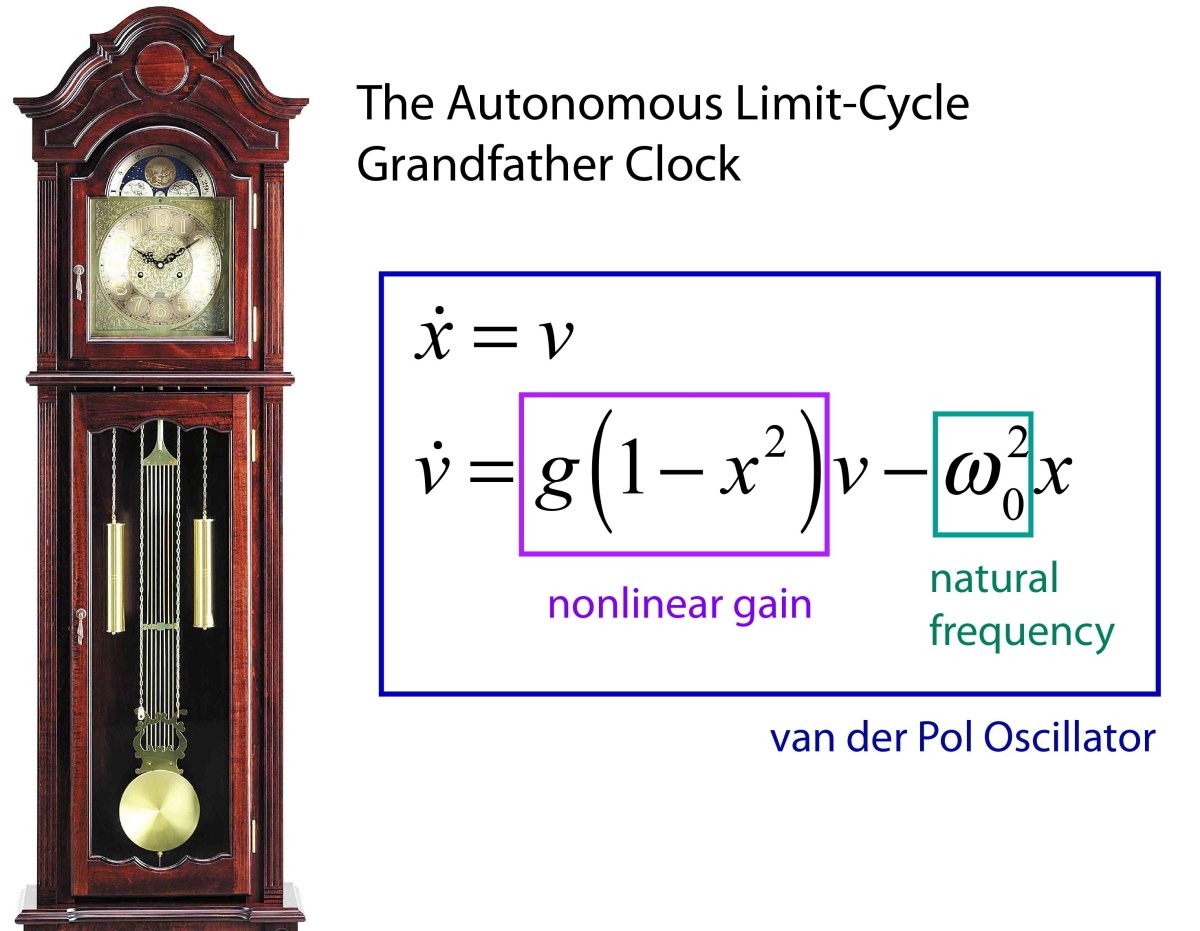
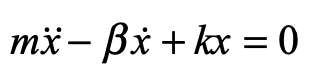
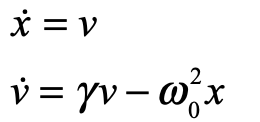
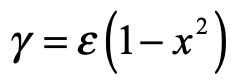
This final topic extends the ideas of dynamics into abstract spaces of high dimension to encompass the idea of a trajectory of life. Health and disease become dynamical systems defined by all the proteins and nucleic acids that comprise the physical self. Concepts from network theory, autonomous oscillators and synchronization contribute to this viewpoint. Healthy trajectories are like stable limit cycles in phase space, but disease can knock the system trajectory into dangerous regions of health space, as doctors turn to new developments in personalized medicine try to return the individual to a healthy path. This is the ultimate generalization of Galileo’s simple parabolic trajectory.
1642 Galileo dies
1656 Huygens invents pendulum clock
1665 Huygens observes “odd kind of sympathy” in synchronized clocks
1673 Huygens publishes Horologium Oscillatorium sive de motu pendulorum
1736 Euler Seven Bridges of Königsberg
1845 Kirchhoff’s circuit laws
1852 Guthrie four color problem
1857 Cayley trees
1858 Hamiltonian cycles
1887 Cajal neural staining microscopy
1913 Michaelis Menten dynamics of enzymes
1924 Berger, Hans: neural oscillations (Berger invented the EEG)
1926 van der Pol dimensioness form of equation
1927 van der Pol periodic forcing
1943 McCulloch and Pits mathematical model of neural nets
1948 Wiener cybernetics
1952 Hodgkin and Huxley action potential model
1952 Turing instability model
1956 Sutherland cyclic AMP
1957 Broadbent and Hammersley bond percolation
1958 Rosenblatt perceptron
1959 Erdös and Renyi random graphs
1962 Cohen EGF discovered
1965 Sebeok coined zoosemiotics
1966 Mesarovich systems biology
1967 Winfree biological rythms and coupled oscillators
1969 Glass Moire patterns in perception
1970 Rodbell G-protein
1971 phrase “strange attractor” coined (Ruelle)
1972 phrase “signal transduction” coined (Rensing)
1975 phrase “chaos theory” coined (Yorke)
1975 Werbos backpropagation
1975 Kuramoto transition
1976 Robert May logistic map
1977 Mackey-Glass equation and dynamical disease
1982 Hopfield network
1990 Strogatz and Murillo pulse-coupled oscillators
1997 Tomita systems biology of a cell
1998 Strogatz and Watts Small World network
1999 Barabasi Scale Free networks
2000 Sequencing of the human genome
The Physics of Life, the Universe and Everything:
Read more about the history of modern dynamics in Galileo Unbound from Oxford University Press.